
Performance data integration is the process of combining data from separate business systems into one unified view. Each data source—your CRM, accounting software, and operational tools—is a piece of a larger puzzle. When connected, they create a complete picture of your business performance, enabling smarter, faster decisions.
Unlocking a Unified View of Your Business

For most small to mid-sized businesses in South Africa, data is often trapped in isolated silos. Your sales figures are in one system, marketing analytics in another, and operational costs might be tracked on various spreadsheets. This fragmentation makes it nearly impossible to get a straight answer to fundamental questions about your company's health.
Performance data integration breaks down these walls by building bridges between your systems. It is a foundational step in business intelligence that systematically collects, cleans, and combines your information into a single, trustworthy source. The goal is to create one version of the truth that everyone in the organisation can rely on.
Why This Matters for SMEs
For a growing company, this unified view isn't a technical luxury—it's a competitive edge. It allows you to stop making decisions based on incomplete information or gut feelings and start seeing the full picture. You can draw a clear line between cause and effect across different parts of your business.
For example, you could see how a specific marketing campaign directly influenced sales and what that did to your profit margins. That’s the clarity integrated data delivers. This approach is central to smart data engineering and automation, as it removes the manual, error-prone work of exporting data into spreadsheets and piecing it together by hand.
By establishing a single source of truth, performance data integration provides the clarity needed to make smarter, faster decisions without the complexity and cost of massive enterprise systems.
Building Your Foundation for Insight
The process involves creating a structured pipeline where data is extracted from its source, transformed into a consistent format, and then loaded into a central repository. This is where tools like Power BI dashboards shine, turning raw numbers into clear, visual stories. To get a better sense of different methods, you can explore some powerful financial data integration techniques.
Ultimately, performance data integration turns fragmented information into coherent business intelligence. Understanding why you need integration services is the first step toward building a data-driven culture that can react quickly to market shifts and spot growth opportunities.
The Real Pay-off: What Happens When Your Data Starts Talking
Integrating your business systems delivers tangible results that impact your bottom line. It frees your team from manual data tasks so they can focus on growing the business.
The first benefit is having a single source of truth. When your sales, finance, and marketing data all feed into one unified view, you build reports that everyone trusts. No more meetings spent arguing over which spreadsheet has the "right" numbers. With a foundation of trustworthy data, decision-making moves from guesswork to choices backed by solid evidence, lowering risk and improving outcomes.
Streamline Your Operations
Manual data management is a massive time-sink. Many businesses have staff who spend hours each week pulling reports, cleaning them up, and combining them in Excel. This process is slow and prone to human error.
Performance data integration automates these tasks. Through smart data engineering, we build pipelines that automatically pull, standardise, and load your data. This delivers two key benefits:
- It gives your team their time back: Instead of fighting with spreadsheets, they can analyse information and focus on high-value work.
- It reduces costly mistakes: Automation ensures consistent, accurate data, eliminating the risk of a copy-paste error that could lead to a poor business decision.
Consider a South African retailer. They could automatically link their point-of-sale system with their inventory software. Instead of someone manually checking stock levels, managers get a fresh Power BI dashboard every morning. This helps them spot what's running low and optimise orders before they lose a sale.
Get the Full Customer Picture
Your customer data is likely spread across multiple systems—leads in one, sales history in a CRM, and support tickets in another. Each platform only shows a small part of the customer's journey.
Integrating these sources pulls all the pieces together, giving you a complete, 360-degree view of each customer. You can see how they found you, what they bought, and every support interaction they’ve had, all in one place.
This complete picture is invaluable. It helps you identify your best customers, find opportunities to cross-sell, and deliver the personalised experience that builds loyalty.
Imagine a local services company that connects its client database to its invoicing system. They can instantly see who brings in the most revenue, who pays on time, and who requires the most support. That’s powerful intelligence for guiding future sales and marketing strategies.
Need help building your next Power BI dashboard or data automation workflow? Contact DataSimplified to discuss how we can turn your business data into powerful insights.
Understanding Key Data Integration Architectures
To get performance data integration right, you need a solid blueprint. This data architecture is the plan for how information moves from its various sources to a central place for analysis. Getting this right is critical for building a scalable and cost-effective data foundation.
There are a few well-established ways to structure this data flow. Understanding the core concepts will help you determine which technical approach fits your business needs.
The diagram above shows the direct line from a coherent data strategy to tangible business outcomes like better decisions and real growth.
The Classic Approach: ETL
For years, the standard for data integration has been ETL, which stands for Extract, Transform, Load.
- Extract: Data is pulled from source systems like your CRM or accounting software.
- Transform: This raw data is cleaned, standardised, and restructured on a separate server. Different formats are made consistent.
- Load: The clean, structured data is loaded into its final destination, usually a data warehouse, ready for analysis.
This method ensures that only high-quality, pre-processed data enters your analytics environment, making it perfect for structured reporting in tools like Power BI. See why agile ETL tools can benefit your business.
The Modern Alternative: ELT
A newer pattern is ELT, or Extract, Load, Transform, which flips the last two steps.
With ELT, raw data is extracted and immediately loaded into a central repository, often a data lake. The transformation—cleaning and structuring—happens after the data is stored, using the processing power of the destination system itself.
ELT offers great flexibility. It lets you store all your raw data in one place first and decide how to transform it later. This is ideal for exploratory analysis and managing large, unstructured datasets.
This approach is particularly effective in the cloud, where storage is affordable and processing power is readily available.
Data Warehouse vs. Data Lake
Understanding where your integrated data will be stored is also important. The two most common options are data warehouses and data lakes.
- Data Warehouse: A highly organised repository for structured, filtered data that has been processed for a specific purpose. It is built for speed and is the traditional engine behind business intelligence.
- Data Lake: A vast storage repository that holds large amounts of raw data in its native format. It is more flexible but requires more work to prepare the data for analysis.
Many businesses now use a hybrid approach to get the best of both worlds.
Batch Processing vs. Real-Time Streaming
Finally, consider the timing of your data movement.
- Batch processing moves data in scheduled chunks—for example, once a day or every hour. It is efficient for large volumes of data where immediate updates are not required, such as daily sales reports.
- Real-time streaming processes data continuously as it is created. This is essential for instant insights, like monitoring website traffic or tracking a delivery vehicle in real time.
For a deeper technical overview, this practical guide to building data pipelines is a useful resource. This shift toward modernising data is a strategic priority across South Africa. Statistics South Africa’s strategic plan highlights the need to integrate diverse data sources to better support national development, showing that effective data management is a top priority at all levels.
The Essential Tools for Your Integration Stack
Choosing the right tools for your data integration strategy is a critical decision. For an SME, the goal is to find technology that offers significant power without enterprise-level complexity and cost.
Your "stack" should cover the entire data journey, from extraction to visualisation. This usually means combining a data pipeline tool, a flexible cloud platform, and a solid business intelligence solution.
Modern ETL Tools for Automation
At the core of any integration project are the tools that automate data movement. Modern ETL (Extract, Transform, Load) platforms are the workhorses of your data operations. They build reliable data pipelines that connect to your various data sources, clean the information, and deliver it to a central hub.
These platforms allow you to replace manual, error-prone spreadsheet work. Instead of developers writing custom scripts, these tools provide visual workflows that make building and maintaining pipelines much faster.
Cloud Platforms as the Foundation
A robust cloud platform provides the scalable, cost-effective infrastructure needed for data integration. Services like Microsoft Azure offer everything an SME needs to store, process, and analyse data without buying and managing expensive on-site hardware.
Key cloud components include:
- Data Storage: Solutions like Azure Blob Storage offer affordable and durable storage for raw and processed data.
- Processing Power: Services like Azure Synapse Analytics provide the computational power for complex transformations.
- Database Services: Managed databases like Azure SQL Database offer a secure, high-performance home for your structured data.
The pay-as-you-go model of the cloud is a significant advantage. You can start small and scale your infrastructure as your business grows, making enterprise-level data capabilities accessible to any company.
Business Intelligence and Visualisation Hubs
The final piece of your toolkit is the business intelligence (BI) platform. This is where your integrated data comes to life as actionable insights. A tool like Microsoft Power BI is more than just a chart-maker; it's a powerful integration hub.
Power BI has a built-in ETL engine (Power Query) that connects to hundreds of data sources. It lets you model data, create relationships between tables, and build interactive Power BI dashboards that allow your team to explore data and answer their own questions.
Comparing Data Integration Approaches
Choosing the right method depends on your specific needs, from budget and team skills to the type of data you're working with.
| Approach | Best For | Key Benefit | Consideration |
|---|---|---|---|
| Manual (Spreadsheets) | Very small-scale, one-off tasks. | No initial cost if you own the software. | Highly error-prone, not scalable, and time-consuming. |
| Custom Scripts (e.g., Python) | Teams with strong in-house development skills. | Complete customisation and control. | Requires ongoing maintenance; can become complex and hard to document. |
| Dedicated ETL Tool | Businesses needing reliable, automated data pipelines. | Scalability, reliability, and visual workflows that speed up development. | Involves a software subscription cost. |
| BI Platform (e.g., Power BI) | Teams focused on analysis and visualisation. | All-in-one solution for integration and reporting for many common sources. | May struggle with very large or complex data transformation needs. |
Many businesses use a combination of these approaches. A dedicated ETL tool might handle heavy data flows, while a BI platform like Power BI handles the final analysis and visualisation. Trends in South African data platforms show a clear move toward supporting these integrated capabilities. You can read more about these market advancements and what they mean for the future of data analytics.
How South African SMEs Use Integrated Data
Seeing performance data integration in action makes its value clear. For South African SMEs, it is a practical way to solve operational challenges, reduce costs, and uncover hidden growth opportunities.
Let’s look at a few practical examples.
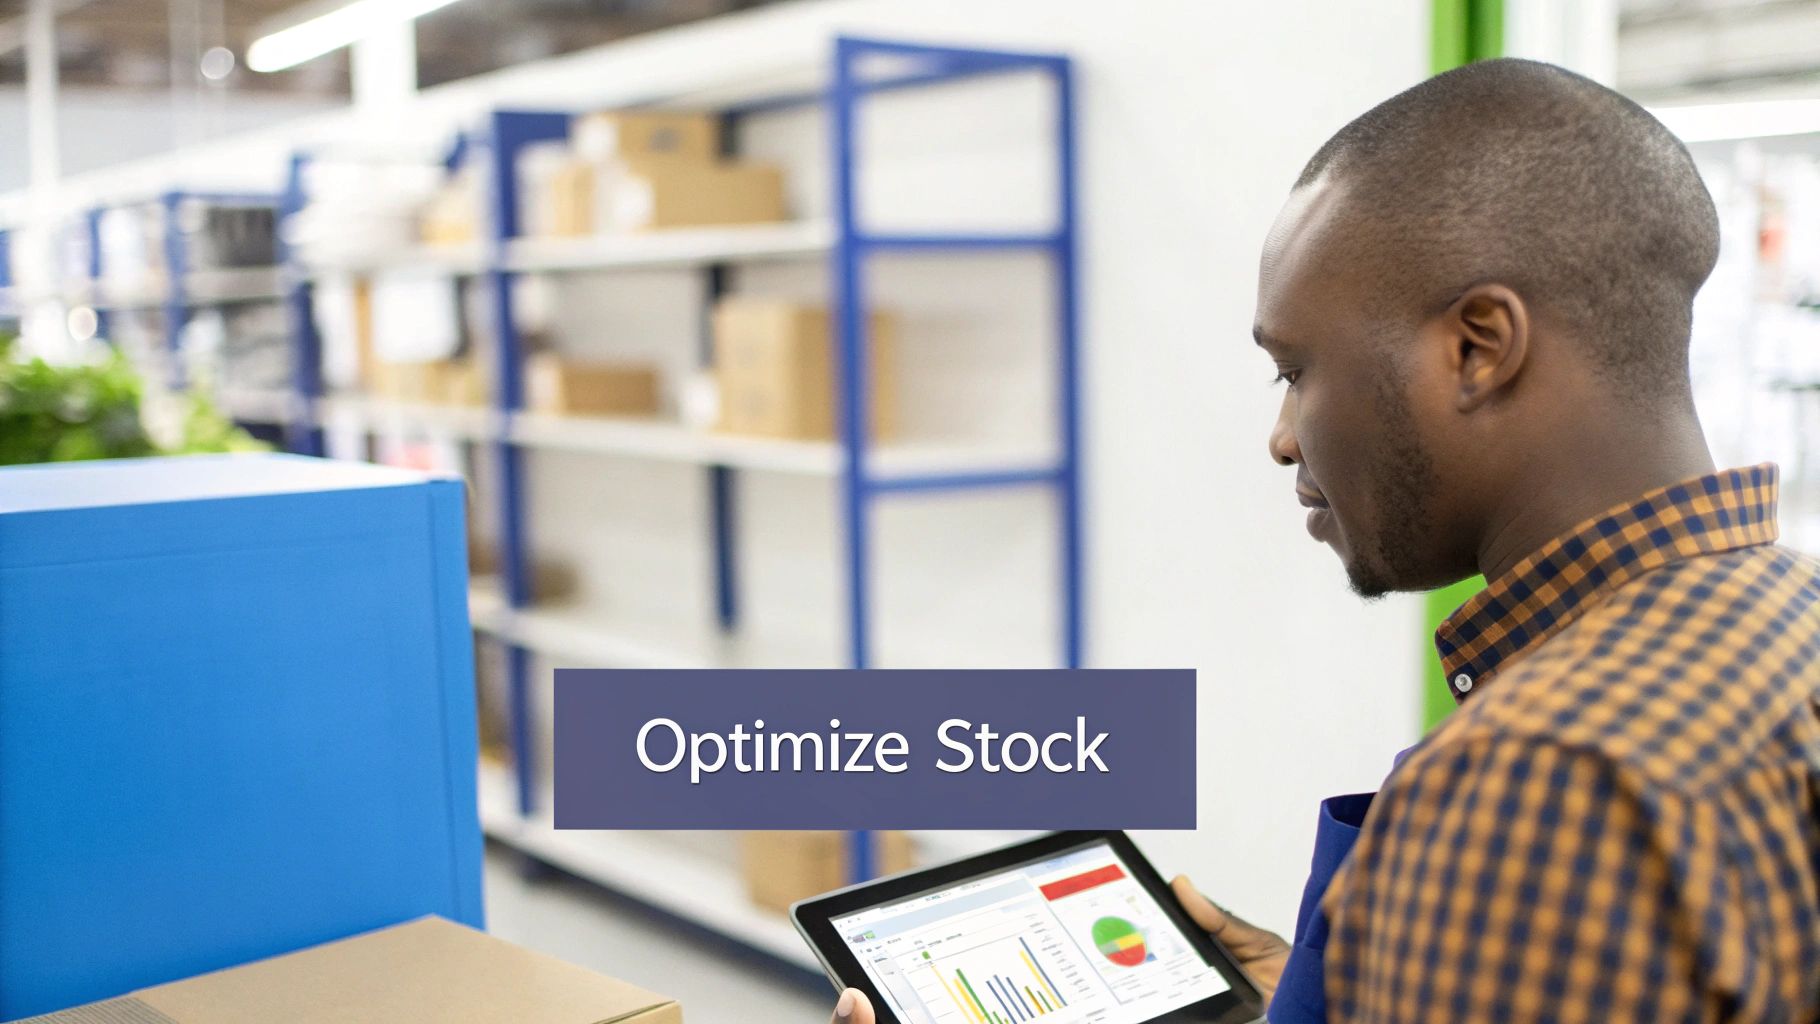
These scenarios show how a smart data pipeline and a powerful Power BI dashboard can transform a local business. The goal is always to turn scattered information into a competitive edge.
Optimising Logistics and Reducing Fleet Costs
Consider a mid-sized logistics company in Gauteng. Their delivery vehicles have GPS trackers, drivers log fuel costs in an app, and schedules are in another system. None of these systems communicate.
With a performance data integration solution, they can:
- Pull GPS tracking data, fuel purchase records, and delivery manifests into one place.
- Calculate key metrics like fuel consumption per kilometre and time spent per delivery.
- Feed this unified data into a central model for a clear, big-picture view.
The result is a single Power BI dashboard showing route efficiency in real time. Managers can see which routes are draining profits, where drivers are idling too long, and how fuel costs align with delivery zones. These insights allow them to optimise routes, cut fuel spend, and improve delivery times, directly boosting profitability.
Driving Retail Success with Unified Sales Data
Think of a local retailer with several physical stores and an online shop. They use a point-of-sale (POS) system in-store, an e-commerce platform for their website, and another tool for marketing campaigns. Determining which products are selling well and if marketing spend is effective is a constant challenge.
A data integration project connects these dots. By merging POS transactions, online sales data, inventory levels, and marketing spend, the business gets a complete picture of its commercial health.
This unified perspective allows managers to accurately measure campaign effectiveness, understand which products sell best through which channels, and manage stock levels to prevent costly overstocking or stockouts.
Improving Profitability for Professional Services
Take a professional services firm, like an engineering or consulting practice. They track billable hours in a timesheet system and manage projects in a separate tool. Without connecting the two, it's nearly impossible to know if a project is profitable until it's too late.
By linking timesheet data with project milestones and budgets, the firm can build a real-time profitability dashboard. This empowers leaders to monitor project health, identify their most profitable clients, and reallocate resources before a project goes over budget.
These examples show how data automation and integration deliver tangible results. This thinking is also applied on a larger scale. The South African government has invested in platforms that pull together cross-border trade data to better monitor regional markets, proving the power of connected data. You can learn more about these regional integration efforts.
Your Data Integration Implementation Checklist
https://www.youtube.com/embed/LKFaa54VoLM
Starting a performance data integration project can feel daunting, but a step-by-step approach makes it manageable. The key is to start small, show value quickly, and use that success to build momentum.
Phase 1: Define Your Objective
Before considering tools, you must know why you are doing this. What is the end goal? Start by pinpointing the most urgent business questions your disconnected data cannot currently answer.
Good questions are specific and tied to a business result:
- Which of our marketing channels brings in the highest-value customers?
- How do our daily sales in KwaZulu-Natal compare to Gauteng, and what drives the difference?
- What is the true profitability of a project when we factor in all associated staff time?
Avoid vague goals like "we want better data." A focused objective ensures your first project delivers real value and helps get organisational buy-in.
Phase 2: Audit Your Data Sources
With a clear goal, it's time to identify the data you need. This involves finding where crucial information is stored and assessing its quality.
Create a simple inventory of your key systems. For each one, ask:
- Where is it? Is it in Xero for finance, Pipedrive for sales, or a custom SQL database?
- Who owns it? Who is the point of contact for access and understanding its structure?
- How clean is it? Be honest. Is the data consistent and complete, or are there gaps and messy entries?
This audit provides a realistic map of your data landscape. It helps you identify potential roadblocks early and plan the data engineering work required to clean everything up.
Phase 3: Plan and Pilot
Now you can design a solution. This is where you select your tools and architecture, but you don’t need to build the entire system at once. The smart approach is to plan a small pilot project focused on answering your initial business question.
A pilot project is your proof of concept. The aim is to score a quick win that proves the power of integrated data, such as a single Power BI dashboard answering one critical question.
For your pilot, you will need to:
- Select Your Tools: Based on your data sources and goals, choose an integration method. You might opt for a dedicated ETL tool or use the features built into a business intelligence platform like Power BI.
- Design the Pipeline: Sketch the journey your data will take from source to destination. Decide where transformations will happen and what the final data model should look like.
- Build and Test: Implement the pilot pipeline and dashboard. Involve the end-users—managers and decision-makers—to test it and provide feedback.
Starting with a targeted pilot minimises risk and cost. It delivers immediate value, making it easier to get approval for expanding your data automation and integration efforts later.
Need help building your first data automation workflow or Power BI dashboard? Contact DataSimplified to see how we can help turn your business data into powerful insights.
Frequently Asked Questions
When considering a performance data integration project, a few practical questions often arise. Here are some of the most common ones we hear from South African business owners, along with direct answers.
What Does a Starter Integration Project Typically Cost?
For an SME, your first project should focus on a high-impact win, not a massive overhaul. A typical pilot project—like connecting two or three core systems to create a single Power BI dashboard—is often more affordable than businesses expect.
The final cost depends on:
- Data Complexity: How clean is your source data? Messy data requires more initial data engineering effort.
- Number of Sources: Linking two systems is simpler and more cost-effective than connecting five.
- Dashboard Scope: A dashboard with a few key metrics is quicker to build than one with complex analytical features.
A well-planned pilot project is designed to deliver a strong return on investment quickly, proving the value before you commit to a larger data automation initiative.
How Long Until We See Results from a New Dashboard?
A pilot project is designed to deliver value fast. You can expect to see tangible results from a new Power BI dashboard much sooner than you think. While a company-wide integration can take months, a focused initial project can start delivering insights in just a few weeks.
A typical timeline involves a week or two for discovery and planning, a couple of weeks for development and testing, and then immediate access to insights once it goes live. You don’t have to wait for the entire project to be "done" to start making smarter decisions.
What In-House Skills Do We Need to Manage This?
Many business owners worry they need to hire a team of data scientists. For day-to-day use, this isn't necessary. A well-designed system, especially one visualised in Power BI, is built for business users, not just technical experts.
To get the most value, your team only needs:
- Analytical Curiosity: People who are keen to ask questions and explore the data to find answers.
- Basic Dashboard Literacy: Comfort with using filters and drill-down features in a tool like Power BI.
As for the complex backend—the data pipelines and infrastructure—that's where a partner like DataSimplified comes in. We handle the heavy lifting of ETL and integration so your team can focus on using the insights to grow the business.
Ready to turn your scattered data into a real competitive advantage? DataSimplified specialises in building the data pipelines and Power BI dashboards that help South African businesses make better decisions.
Contact us today to discuss your first data integration project.
