
Business Intelligence (BI) tools transform raw operational data—sales figures, financial reports, customer logs—into clear, interactive visuals that tell a story. Instead of relying on guesswork, these platforms provide actionable signals, helping you shift from gut-feel decisions to data-backed strategy. For any growing South African business, this is a game-changer.
Understanding Business Intelligence Tools
Running a business without clear data is like trying to navigate without a map. Many small and mid-sized enterprises (SMEs) make critical decisions with incomplete information. BI tools solve this by providing a single, clear view of what’s happening across the organisation.
At their core, BI tools perform a few crucial jobs:
- Connecting Data Sources: They securely plug into your various systems, from spreadsheets and cloud accounting software like Xero to SQL databases.
- Cleaning and Structuring Data: They extract raw information, clean it, and structure it through a process called ETL (Extract, Transform, Load). This ensures the data you analyse is consistent and trustworthy.
- Visualising Information: They turn prepared data into charts, graphs, and interactive dashboards that are easy to understand at a glance.
- Sharing Insights: They allow you to build and automate reports, so the right people get the right information securely.
Moving Beyond Simple Spreadsheets
Spreadsheets are useful, but they have serious limitations. Manual updates lead to human error, and they become slow and unwieldy as data grows.
BI tools automate this entire workflow, delivering live, accurate data that reflects what's happening in your business right now. This is the foundation of effective business intelligence and reporting, turning static numbers into a dynamic asset.
For a South African retailer, this could mean instantly seeing which products are selling best in Gauteng versus the Western Cape. A logistics company could use a live dashboard to track delivery times and fuel costs, flagging inefficiencies as they occur.
The real power of BI is its ability to surface trends, patterns, and outliers that would otherwise remain buried in rows of data. It empowers you to ask deeper questions and get immediate answers.
What BI Delivers for Your Business
The goal isn't just to look at data—it's to use it for better outcomes. With comprehensive reporting and analytics services, you can spot sales trends before competitors, find hidden operational bottlenecks draining profits, and understand what your customers truly want. For an SME, this is how you compete and make smarter, more confident decisions.
Need help building your first Power BI dashboard or automating your data workflows? Contact DataSimplified to discuss how we can turn your business data into powerful insights.
Finding the Right BI Tool for Your Business
The business intelligence market isn’t one-size-fits-all. Choosing the wrong platform is like using a massive freight truck for a small local delivery—inefficient and expensive. For South African SMEs, understanding the main categories of BI tools is the first step toward a smart, scalable investment.
The core challenge is always moving from messy, disconnected data to clear, confident decisions. This journey is about choosing the right path.
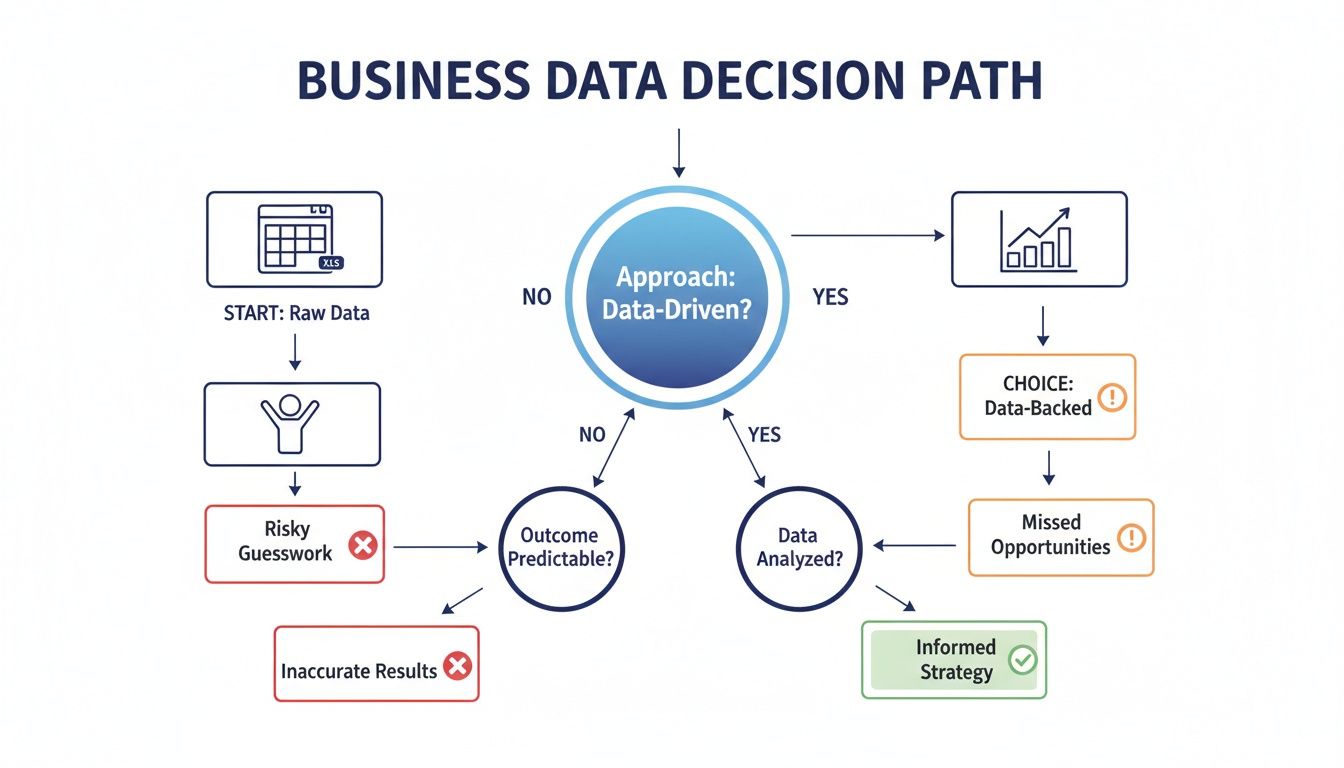
Without a structured approach, businesses often fall back on guesswork. A data-backed path, however, leads directly to actionable insights that fuel real growth.
Self-Service BI Platforms
Self-service BI tools like Microsoft Power BI and Tableau are popular with SMEs for good reason. They empower business users—operations managers, sales leaders, marketers—to connect to data, build reports, and explore insights without writing code.
You are handing your team a powerful calculator instead of forcing them to do complex maths by hand. They can answer their own questions and test ideas without waiting for a dedicated IT team.
- Best For: Teams wanting to build a data-driven culture and enable non-technical staff to do their own analysis.
- Typical Cost: Many start with a free version (like Power BI Desktop), with affordable per-user monthly licences for sharing and collaboration.
- Skill Required: Proficiency in Excel provides a good foundation to get started.
Enterprise BI Systems
Enterprise BI systems are the heavy machinery of the analytics world, built for larger organisations with complex data environments and strict governance rules. They offer robust security, advanced data modelling, and pixel-perfect reporting for formal financial statements.
While powerful, they demand specialised technical skills to manage, making them less agile and more costly than self-service tools. They are built for stability and control, not widespread, exploratory analysis.
Embedded Analytics
You have likely used embedded analytics without realising it. These are the dashboards and charts that live directly inside the software you use daily, like the cash flow graph in your accounting software or the sales pipeline chart in your CRM.
The advantage is convenience and context. Insights are delivered where you do your work, so you don't have to switch between applications.
Embedded analytics brings data to the user, not the other way around. This approach integrates insights into daily workflows, making data-driven actions feel natural and immediate.
For a South African business, this could mean seeing real-time stock levels within an inventory app or customer support metrics inside a helpdesk platform. It makes data a natural part of the job.
Custom-Developed BI Solutions
Sometimes, an off-the-shelf tool isn't enough. Your business might have a unique process, proprietary data, or a specific user experience in mind. This is where a custom-developed solution, often part of a SaaS MVP development project, is the best fit.
Building from scratch gives you absolute control over functionality, user interface, and integrations. While it requires a larger upfront investment, the result is a BI solution that can become a genuine competitive advantage.
Comparison of BI Tool Categories for SMEs
This table breaks down the key characteristics of each BI tool category to help you decide which approach best suits your business needs, budget, and internal skills.
| Tool Category | Best For | Typical Cost | Technical Skill Needed | Scalability |
|---|---|---|---|---|
| Self-Service BI | Empowering non-technical teams to analyse data quickly. | Low (often free to start, with affordable per-user licences). | Basic (Excel-level proficiency is a good start). | High (scales from individuals to departments). |
| Enterprise BI | Large organisations with complex data and strict governance needs. | High (significant licensing, infrastructure, and staff costs). | High (requires specialised IT and data engineering skills). | Very High (designed for enterprise-wide deployment). |
| Embedded Analytics | Integrating insights directly into existing applications. | Varies (often included in a SaaS subscription or as an add-on). | Very Low (end-user); High (developer). | Depends on the host application. |
| Custom BI | Businesses with unique processes that off-the-shelf tools can't support. | Very High (requires a full software development budget). | Very High (requires a dedicated development team). | Custom (built to your specific scaling requirements). |
Choosing the right category is the first critical decision on your data journey. It sets the foundation for how your team will interact with data and, ultimately, how successful your BI strategy will be.
Need help building your next Power BI dashboard or data automation workflow? Contact DataSimplified to discuss how we can turn your business data into powerful insights.
Your Checklist for Choosing the Right BI Tool
Selecting a BI tool is a significant decision. Get it right, and it becomes the heartbeat of your company's decision-making. Get it wrong, and it’s just another expensive, unused subscription.
This practical checklist is built around the critical questions every South African SME leader should ask before committing. It’s about finding a genuine partner for your growth.
Data Connectivity and Integration
First, can the tool connect to your data? A BI tool that can’t access your information is useless, no matter how impressive its dashboards look.
Ask these direct questions:
- Can it connect to our core systems? Think about accounting software like Sage or Xero, your CRM, and other essential platforms. Does the tool have ready-made connectors?
- What about our custom data? Can it pull data from an internal SQL database or organised spreadsheets?
- How difficult is the setup? Will connecting your systems require days of custom data engineering and complex ETL (Extract, Transform, Load) scripts, or is it a straightforward process?
A tool that struggles to integrate with your existing technology will cause constant frustration and kill a project’s momentum from the start.
Usability and User Adoption
A powerful tool that no one uses is a failed investment. The most important measure of a BI project's success is user adoption. Your goal is to empower your team, not force another complicated system on them.
A key challenge for South African organisations is the 'deployment gap'—having the intention to adopt BI but delaying implementation. Factors like management support and compatibility with existing systems play a huge role in moving from a pilot project to full-scale deployment.
The complexities of adoption in the local market underscore why this must be evaluated carefully. You can explore the research into BI adoption factors within the South African business environment to learn more. The most effective business intelligence tools are intuitive enough for a non-technical manager to build a basic report without calling IT.
Security and Data Governance
When you consolidate your company’s sensitive information—financials, customer details, operational data—security must be the top priority.
Your security checklist must include:
- Who sees what? Does the tool allow for role-based access? A sales rep should only see their performance numbers, while a director gets the full company overview.
- Where is the data stored? If you’re using a cloud tool, where are the data centres located? Does this comply with South African data privacy laws like the Protection of Personal Information Act (POPIA)?
- How is the data protected? Ask about encryption standards for data at rest (stored) and in transit (being sent to a dashboard).
Never compromise on security. A data breach can cause permanent damage to your reputation and bottom line.
Scalability and Total Cost of Ownership
Your business is growing, and your BI tool must keep up. A solution that works for five users might fail with 50. Consider how the platform will perform in two or five years as your data volumes and user numbers increase.
Finally, look beyond the monthly license fee. The Total Cost of Ownership (TCO) provides a more honest picture of the true investment.
TCO includes:
- Licensing Fees: Per-user or per-server costs.
- Implementation Costs: Initial setup, data integration, and building the first dashboards.
- Training Costs: Getting your team skilled and confident.
- Maintenance and Support: Ongoing technical help and platform updates.
Choosing a tool based on the cheapest license is a false economy. A slightly more expensive tool that is easier to implement and that your team enjoys using will almost always deliver a better return on investment.
Need help building your next Power BI dashboard or data automation workflow? Contact DataSimplified to discuss how we can turn your business data into powerful insights.
Why A Strong Data Foundation Is Not Optional
A powerful BI tool running on messy, unreliable data is like a high-performance car running on dirty fuel. It looks impressive but won’t get you anywhere. The clean charts and sharp insights on a dashboard are the final layer of a deeper, critical process. Your data architecture is the real engine driving your BI strategy.
Think of it like a professional kitchen. Your data sources—accounting software, sales spreadsheets—are raw ingredients. The ETL (Extract, Transform, Load) process is the chef who preps, cleans, and combines those ingredients. Without that prep work, you’re serving decision-makers a dish of random, mismatched parts.
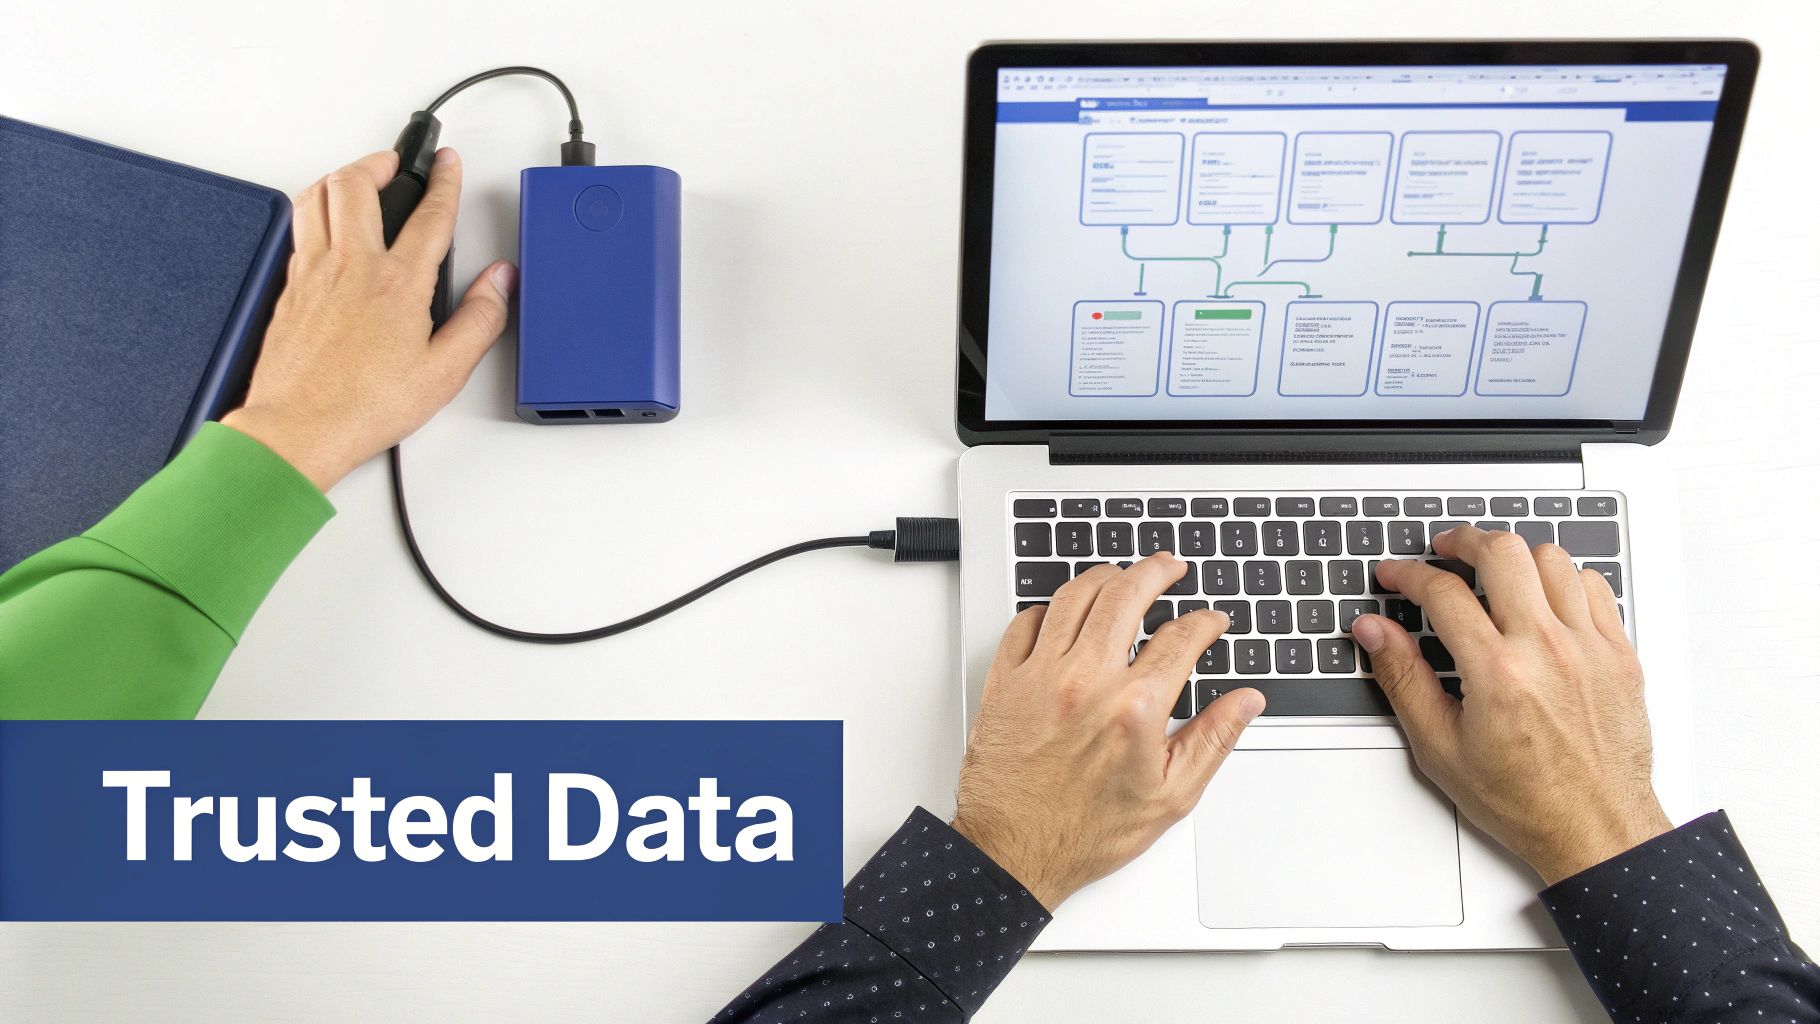
From Raw Data To Reliable Insights
The journey from a raw spreadsheet to a trustworthy dashboard is not magic; it involves deliberate steps. This is the world of data engineering—the discipline of building "pipelines" that move data from its source, clean it, and load it into a system ready for analysis.
This is why at DataSimplified, we start by building robust data pipelines. Using tools like SQL Server or custom Python scripts, we create automated processes that guarantee your data is accurate and consistent before it ever reaches a report.
This foundational work solves critical problems like:
- Standardising Formats: Ensuring "Gauteng," "GP," and "Gauteng Province" are all treated as the same location.
- Handling Missing Values: Deciding how to manage records with empty fields so they don’t skew your analysis.
- Validating Data: Running checks to ensure sales figures are positive numbers and dates follow the correct format.
Skipping these steps means your BI tool will simply amplify existing chaos, leading to flawed conclusions and poor business decisions.
The Role Of A Data Warehouse
Once your business pulls data from multiple places, a central repository becomes essential. A data warehouse acts as this "single source of truth." It's a structured environment where all your cleaned data is stored, ready for your BI tools to connect.
A BI tool is only as good as the data it's fed. Investing in a solid data foundation isn't an optional extra; it's the core requirement for generating insights you can actually trust to run your business.
To maximise your BI investment, it is also essential to implement robust data governance best practices. This framework ensures your data remains accurate and secure over the long term, protecting the integrity of your entire analytics system. A strong foundation makes your BI tools pay off, delivering reliable insights that drive real growth.
Need help building your next Power BI dashboard or data automation workflow? Contact DataSimplified to discuss how we can turn your business data into powerful insights.
How to Launch Your First BI Project Successfully
Ready to get started with Business Intelligence? Instead of a massive, company-wide implementation, start small. A pilot project, or a Minimum Viable Product (MVP), is a smarter approach. The goal is to get a quick, tangible win that builds buy-in and proves the value of data-driven decisions without a huge upfront risk. This is the agile method we use at DataSimplified to help clients see results in weeks, not years.

Step 1: Start with a Single, Critical Question
Forget analysing everything. Pinpoint one high-impact business question that needs a clear answer. This focus keeps the project manageable and ensures the outcome is immediately useful.
Good starting questions for a South African SME could be:
- Who were our top 10 most profitable customers last year?
- Which of our products have the highest and lowest profit margins?
- What is the average invoice payment time, broken down by client?
- Which sales channels bring in the most valuable leads?
The right question is one where the answer leads to obvious, immediate action.
Step 2: Identify and Connect the Necessary Data
Once you have your question, find where the answer lives. For profitable customers, you’ll likely need data from your accounting software (like Sage or Xero) and perhaps your sales CRM.
This is where the initial data engineering comes in. You don't need a full data warehouse at this stage. The goal is to create a clean connection to the one or two data sources required to answer your specific question. This keeps your ETL and integration process focused and efficient.
Step 3: Build a Simple, Focused Dashboard
With your data connected, build your first dashboard. The keyword is simplicity. Resist the urge to add dozens of charts. This dashboard should do one thing only: answer the critical question from step one.
For example, if your question is "Who are our most profitable customers?", the dashboard might only need:
- A bar chart ranking customers by total profit.
- A table showing the top 10 customers with key metrics.
- A filter to view the data by month or quarter.
This minimalist approach makes the dashboard easy to understand and use. It provides a clear signal, not just more noise.
The purpose of an MVP dashboard isn't to be perfect. Its purpose is to deliver a single, valuable insight faster and more reliably than was possible before.
This rapid delivery of value is a powerful motivator. The business intelligence software market in South Africa is projected to grow annually by 3.89% between 2025 and 2030, reaching an estimated market volume of $129.92 million USD. You can discover more about South African BI market trends on Statista.com.
Step 4: Share and Gather Feedback
Share the first dashboard with a small group of key stakeholders—the people who will use this information. Walk them through it, show them how it works, and listen to their feedback.
Their input is invaluable. They might suggest a different way to calculate a metric or ask for a filter that would make the dashboard more useful. This feedback loop is essential for refining your solution.
Step 5: Iterate and Expand
Once you’ve proven the value of your first BI project and incorporated feedback, start the process again. Pick the next critical business question, connect the next data source, and build the next focused dashboard.
This iterative approach minimises risk, controls costs, and slowly builds a strong, data-driven culture. It’s how you successfully implement powerful business intelligence tools without the overwhelm.
Need a hand building your next Power BI dashboard or data automation workflow? Contact DataSimplified to discuss how we can turn your business data into powerful insights.
Why Power BI Is a Game-Changer for SMEs
For many South African small and mid-sized businesses, BI can feel out of reach. Many tools seem built for large corporations with matching price tags and complexity. This is where Microsoft Power BI shines—it hits the sweet spot between powerful features and affordability, making it an ideal starting point for building a data-savvy culture.
Its biggest advantage is its seamless integration with software your business already uses, like Excel, Office 365, and SQL Server. This smooth connectivity cuts down on the initial setup headaches that often stall BI projects.
Accessible Yet Powerful
Power BI's design has a "low floor and a high ceiling." This means anyone comfortable in Excel can download the free Power BI Desktop app and start building reports within hours. This empowers your team—the people who understand the business realities—to get answers to their own questions.
But it doesn't stop there. As your needs grow, Power BI offers advanced tools for sophisticated data automation and modelling. This flexibility means the tool scales with you, supporting your journey from a single spreadsheet to live, company-wide dashboards.
The real value of Power BI for an SME is its ability to put data directly into the hands of people making daily decisions. It closes the gap between raw information and genuine business insight.
Practical Applications for Your Business
The benefits are immediate and tangible. You can move away from static, outdated reports and create a living view of your business’s health.
Consider these real-world scenarios:
- Live Sales Tracking: Combine sales sheets into a live dashboard tracking revenue by province, salesperson, or product line, updated automatically.
- Operational Monitoring: Connect to a database to watch stock levels in real-time, getting alerts for items that need reordering.
- Financial Health: Pull information from your accounting software to see cash flow, outstanding debtors, and monthly expenses on a single screen.
These are not multi-year projects; they are quick wins that deliver value from day one. To learn more, you can explore Power BI’s role in transforming business intelligence. It gives SMEs the kind of insights once reserved for big enterprises, without the associated cost and complexity.
Need a hand setting up your first Power BI dashboard or automating your data workflow? Contact DataSimplified to see how we can turn your business data into powerful, actionable insights.
Common Questions About Business Intelligence Tools
When business leaders first explore BI solutions, a few common questions always arise. Here are some straightforward answers.
How Much Does a BI Solution Really Cost an SME?
It varies. You can start building reports for free with a tool like Power BI Desktop. Once you need to share and collaborate, paid cloud licences often start at a few hundred Rands per user, per month.
However, the main investment is often the initial setup. A simple project pulling from clean data sources might only require a few days of consulting work. A complex integration from multiple messy systems will cost more. The key is to start small with a focused MVP, prove the ROI, and then scale up.
Do I Need a Full-Time Data Analyst to Use These Tools?
For day-to-day use, probably not. Modern self-service business intelligence tools are built for business users comfortable with Excel. They are designed to let your team ask and answer their own questions.
However, getting the foundation right is critical. We recommend bringing in a data professional to connect data sources, build a solid data model, and ensure reliability from the start. This upfront investment ensures your team builds reports on trustworthy data, preventing bad decisions based on bad data.
How Quickly Can We Expect to See Results?
You should see your first meaningful dashboard within weeks, not months. By focusing on an MVP, the goal is to score a quick win that answers a specific business question, like identifying top-performing products or clarifying client payment cycles.
While a full, company-wide BI implementation is a longer journey, you should expect to see real value delivered in small increments from the beginning.
Is There Demand for BI Skills in South Africa?
Yes. The demand for professionals skilled in business intelligence tools is climbing sharply across South Africa. Industries from retail and finance to healthcare are investing in analytics to improve operations, manage resources, and spot financial fraud.
This has led to a boom in BI-related jobs, though a local skills shortage remains a challenge. If you're interested in the local landscape, you can discover more insights about the demand for BI skills on Masterdata.co.za.
Need help building your next Power BI dashboard or data automation workflow? Contact DataSimplified to discuss how we can turn your business data into powerful insights.
