
A data warehouse is your company’s central library for historical information. It’s not just a storage unit; it's a structured repository designed for analysis and reporting. It pulls data from all your business systems—sales, finance, marketing, operations—cleans it up, and makes it consistent, giving you a single, unified view of your business for spotting trends and building insightful Power BI dashboards.
Defining a Data Warehouse for Business
Imagine your business runs on several systems: accounting software like Xero, a CRM managing customer data, and a separate system for inventory. Each is great at its job, but seeing the bigger picture is a challenge. Pulling reports from each system often leaves you with conflicting numbers and a mountain of spreadsheets.
This is the problem a data warehouse solves. It’s not just another database; it’s a system purpose-built for business intelligence.
A data warehouse serves as the single source of truth for your organisation. It prepares and stores historical data in a way that’s optimised for deep analysis, not for day-to-day transactions.
From Daily Operations to Strategic Insight
The core difference is purpose. The databases that run your daily operations are called Online Transaction Processing (OLTP) systems. They are designed for speed and efficiency—processing a sale, updating a customer's address, or logging a support ticket.
A data warehouse, in contrast, is an Online Analytical Processing (OLAP) system. Its mission isn’t to record new transactions but to analyse all transactions that have ever happened. This historical view is what makes it powerful for strategic planning.
Why the Difference Matters
This distinction is crucial for small and mid-sized businesses. If you run complex analytical reports directly on your live operational database, you'll likely grind it to a halt. This slowdown directly impacts your team's ability to do their jobs and serve customers.
A data warehouse creates a necessary separation between these two workloads.
- Your operational systems stay fast: Your team can process orders and serve customers without lag.
- Your analytics become powerful: You can analyse years of data to spot patterns or forecast sales without performance hits.
- Your data becomes trustworthy: Through a process called ETL (Extract, Transform, Load), data from all sources is cleaned and standardised, creating a reliable foundation for every report.
By setting up a dedicated environment for analysis, you empower your team to make decisions based on clear, consolidated insights—not fragmented data.
Need help building a central data repository for your business analytics? Contact DataSimplified to discuss how we can turn your business data into powerful insights.
The Core Architecture of a Data Warehouse
Think of a data warehouse as a structured assembly line for your company's data. It has a few key parts, each with a specific job in turning scattered, raw information into a solid foundation for business decisions. Once you grasp this flow, the concept becomes clear.
The journey starts with your data sources. These are the everyday systems where business happens. For a typical South African SME, this could mean financial data from Xero, customer information from a CRM, stock levels from inventory software, or even Excel spreadsheets. Each system holds a piece of the puzzle. The data warehouse architecture brings those pieces together.
The ETL Process: The Data Assembly Line
At the heart of any data warehouse is a process called ETL: Extract, Transform, and Load. This is the critical data engineering work that ensures the information in your warehouse is clean, consistent, and trustworthy. Without it, you’re just creating a centralised junkyard of messy data.
Here’s how it works:
- Extract: Data is pulled from all its original source systems.
- Transform: The raw data is cleaned, standardised, and reshaped. We might convert currencies to ZAR, fix date formats, or remove duplicate customer entries. This stage turns inconsistent data into a uniform, analysis-ready state.
- Load: Once transformed, the data is loaded into the central data warehouse, ready for your teams to analyse.
This ETL pipeline is fundamental to data automation. It ensures that when someone builds a dashboard in Power BI, they are working from a single, reliable source of truth.
The diagram below gives a high-level picture of this workflow, showing how data flows from different systems into one central hub before being used for analysis.
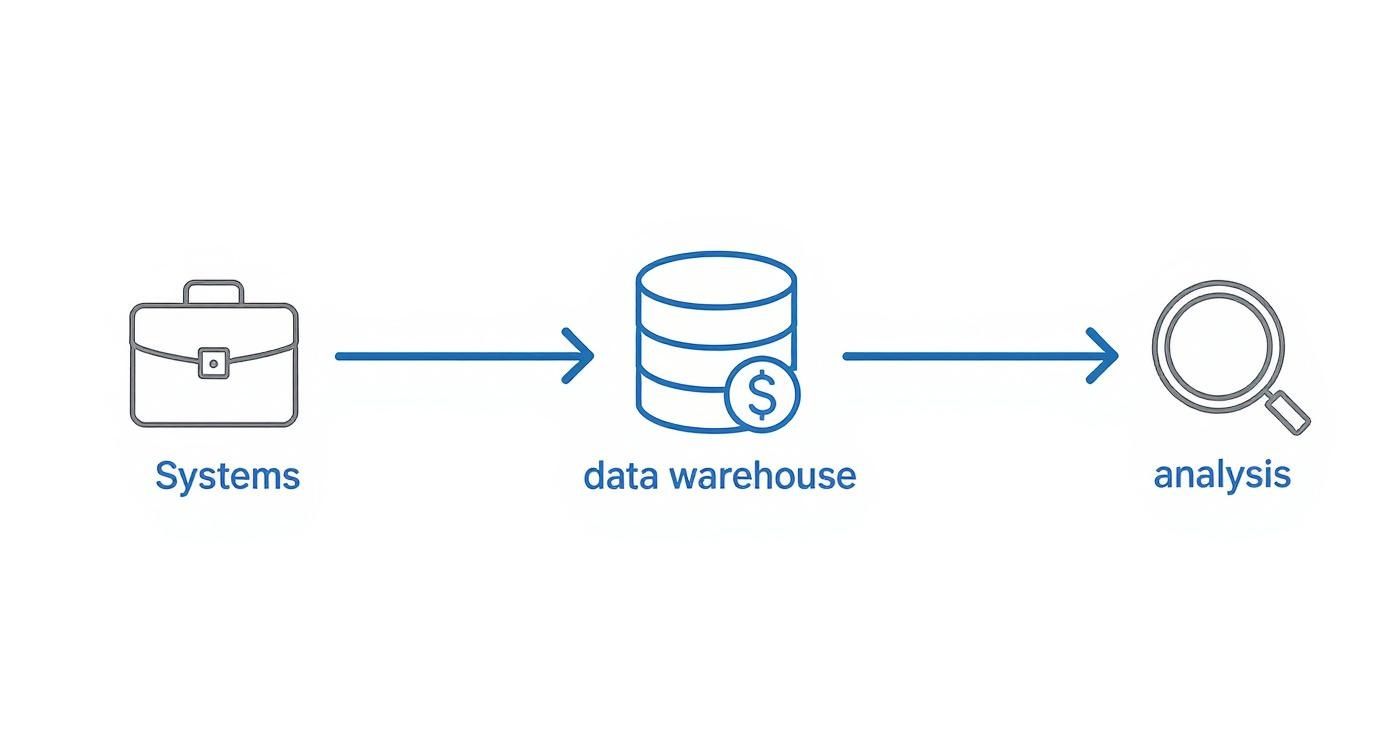
This visual simplifies the journey, highlighting how a data warehouse consolidates information to generate powerful business intelligence.
Staging Areas and Data Marts
Two other components are useful to understand. A staging area is a temporary holding bay where the "Transform" part of ETL happens. Think of it as a workshop where data is prepared before moving to the main library. This separation protects the performance of your daily operational systems and the final data warehouse.
Once clean data is in the central warehouse, it can be organised into data marts.
A data mart is a smaller, focused slice of the data warehouse built for a specific business team. For instance, the sales team gets its own sales data mart, while the finance department gets a separate one.
This approach makes it quicker for teams to get the exact data they need without sifting through the entire company's repository. It’s an efficient way to deliver targeted insights for specific tasks, like building a sales performance dashboard. For a deeper technical look, resources covering platforms like Data Warehouses (Amazon Redshift) can be helpful.
Need help designing a data architecture that provides your team with reliable insights?
Contact DataSimplified to discuss how our data engineering experts can help.
How a Data Warehouse Powers Business Intelligence
A data warehouse is the engine room for your business intelligence (BI) strategy. It bridges the gap between the raw data your business collects and the clear, actionable insights your leaders need. Without this foundation, any BI project can become a mess of conflicting spreadsheets.
A data warehouse creates one stable, consolidated view of everything that's happened in the business over time. It becomes the single source of truth that feeds your analytical tools. This ensures that when anyone asks a question, the answer is consistent and trustworthy.
This ends the common headache where the sales team’s revenue report doesn’t match the finance team’s. When both teams pull from the same validated data warehouse, their reports align. You can then have productive conversations about strategy instead of debating whose numbers are correct.

From Raw Data to Interactive Dashboards
Modern BI tools like Power BI connect directly to a data warehouse. This integration allows business leaders to move beyond static reports to interactive, visual dashboards that tell a story about company performance.
Instead of waiting for IT to compile a report, a manager can explore the data themselves. They can filter by date, region, or product line, and drill down into details to understand the "why" behind the numbers. A well-built data warehouse organises vast amounts of information, often revealing that the key to business growth often lies within your customer data.
The combination of a data warehouse and a BI tool like Power BI transforms data from a passive, historical record into an active, strategic asset.
This is not just for large corporations. For a South African SME, this could mean:
- A retailer analyses sales data to see how a promotion in Gauteng performed compared to one in the Western Cape, helping them spend marketing budget more effectively.
- A logistics company connects fuel costs, driver schedules, and delivery times to pinpoint inefficient routes and boost profitability.
- A services firm tracks project profitability by combining timesheet data with financial records, spotting which projects are most valuable.
Unlocking Deeper Analytical Capabilities
A structured data warehouse supports more than just historical reporting; it unlocks advanced analytics. By storing clean, organised historical data, it lays the groundwork for spotting trends, making forecasts, and even predictive analytics.
The value of this historical context is massive. Your operational systems might hold only a few months of data, but a warehouse is designed to store years of it. This allows you to perform year-on-year analysis, identify long-term customer behaviour, and build more accurate financial forecasts. You can explore our expert services for business intelligence and reporting to see how we help clients put this into practice.
This strategic approach is gaining traction across South Africa. Data warehousing is now a cornerstone for analytics, with even government bodies adopting it to improve reporting. As noted in Statistics South Africa’s strategic plan, the country has prioritised integrating data warehouses to link micro-data and combine survey results with administrative records for more robust analysis. This shows a wider understanding that centralised data is critical for accurate insights.
Need help building your next Power BI dashboard or data automation workflow? Contact DataSimplified to discuss how we can turn your business data into powerful insights.
Data Warehouse vs Data Lake: Understanding the Difference
It's easy to confuse "data warehouse" and "data lake." For a small or mid-sized business, picking the wrong one is a critical mistake that can lead to a costly system that doesn't deliver value.
Think of a data warehouse as an organised public library. Every book—the data—is vetted, categorised, and placed on a specific shelf. It’s built for people who need reliable, structured information quickly to answer specific questions.
A data lake is more like a massive storage depot. It takes in everything in its original, raw format: books, newspapers, delivery slips, audio tapes. This is ideal for someone who wants to rummage through a huge, unfiltered pile of information to discover unexpected connections.
Structure and Purpose: The Core Distinction
The real difference comes down to when you give the data structure, which has huge practical implications.
A data warehouse operates on a schema-on-write principle. Before any data enters the warehouse, it must be cleaned, structured, and fitted to a predefined model. This is the "Transform" step in the ETL process.
- The Upside: Your data is always clean, consistent, and ready for analysis. This is what you need for powering Power BI dashboards and standard business reports where speed and accuracy are crucial.
- The Downside: It’s less flexible. You must decide how you’ll analyse the data before you store it.
A data lake uses a schema-on-read model. It ingests enormous volumes of raw data in its native format. You only apply structure when you pull it out for a specific analysis.
- The Upside: It offers incredible flexibility for deep exploration and advanced analytics, like training machine learning models.
- The Downside: It requires serious technical skill to get any value from it. Without strong governance, a data lake can quickly turn into a "data swamp"—a messy, unusable junkyard.
Which One Is Right for Your Business?
The right choice depends on your business goals and the questions you need to answer.
For most small and mid-sized businesses looking for a clear, consistent view of their operations, a data warehouse is the practical place to start. It’s built to directly support core business intelligence.
Here’s a straightforward comparison:
| Characteristic | Data Warehouse | Data Lake |
|---|---|---|
| Primary Users | Business analysts, operations managers, leadership. | Data scientists, data engineers, advanced analysts. |
| Data Structure | Highly structured and processed. | Raw, unstructured, and semi-structured. |
| Main Use Case | Business intelligence, performance dashboards, historical trend analysis. | Data exploration, predictive analytics, machine learning. |
| Business Goal | Answering known questions with reliable data. | Discovering new questions from vast, varied datasets. |
A data warehouse is built for clarity and reliability, helping you make better daily decisions. A data lake is built for discovery. For most growing businesses, a well-designed data warehouse provides the solid analytical foundation you need.
Need help deciding on the right data architecture for your reporting and analytics needs? Contact DataSimplified to discuss how we can turn your business data into powerful insights.
Key Benefits for South African SMEs
What does a data warehouse actually do for a growing South African SME? The value is direct. It’s about turning complex data work into real-world advantages that help you run a smarter operation.
The most powerful benefit is creating a single source of truth. Your sales and finance teams are finally looking at the same revenue numbers, pulled from the same validated source. This ends frustrating debates over whose spreadsheet is correct and gets everyone on the same page.
Unlock Powerful Historical Insights
Your daily operational systems focus on the now. They aren't built to store years of historical information in an easy-to-analyse way. A data warehouse is designed for exactly that. It lets you dig into long-term trends and uncover business intelligence that gives you a competitive edge.
This capability is a game-changer. A local retailer could analyse years of sales data to predict which products will sell best during the holiday season, allowing them to stock up before the rush hits. This move from reactive to proactive fuels sustainable growth.
The value of efficient data handling is mirrored in the broader economy. The combined warehousing and cold chain market in South Africa—which includes both physical goods and digital data—surpassed USD 1.0 billion in 2024. This growth is fuelled by sectors like logistics and e-commerce that depend on data-driven efficiency. You can explore this trend further in the full South Africa Warehousing and Cold Chain Market Size and Forecast report.
The chart below shows the market's expected growth, underscoring the rising investment in solid storage and data infrastructure.
This forecast points to a consistent upward trend, proving how vital both physical and digital warehousing have become to the national economy.
Drive Faster, More Confident Decisions
With a reliable data warehouse, decision-making speeds up. Instead of waiting days for a manual report, leaders can get up-to-date, trustworthy information from their Power BI dashboards anytime.
This speed and reliability give your team the confidence to act decisively. The key advantages are clear:
- Improved Data Security: Centralising sensitive information in one secure place reduces the risk of a data breach compared to data scattered across different systems.
- Enhanced Competitiveness: A data warehouse gives SMEs access to the same calibre of insights that larger companies use. You can use your own data to find new efficiencies and spot opportunities.
- Scalable Analytics: As your business expands, your data warehouse grows with you. You can start small with one area, like sales, then build out your data model over time. Our guide on leveraging enterprise data warehousing for business growth digs deeper into this scalable approach.
A data warehouse turns your historical data from a forgotten byproduct into one of your most valuable strategic assets.
Need help building a data warehouse that gives your business a competitive edge? Contact DataSimplified to discuss how we can turn your business data into powerful insights.
A Practical Approach to Getting Started
The idea of building a data warehouse can sound overwhelming. But for most SMEs, the right approach is to start small, deliver value quickly, and build from there.
Forget trying to build an all-encompassing system from day one. Instead, ask: What is the most critical business problem we need to answer right now? Maybe it's understanding customer lifetime value or identifying which products are truly profitable.

Start Small with a Targeted Data Mart
Once you have your question, you have your starting point. Focus on a single area that will give you the biggest impact. Sales is often a great place to begin because its metrics tie directly to the bottom line.
By focusing on one domain, you can build a targeted data mart—a mini-warehouse. This approach is perfect for an SME for a few key reasons:
- Faster Results: You can deliver a working solution, like a focused Power BI dashboard, in weeks or months, not years.
- Lower Initial Cost: The investment is a fraction of a full-scale build, making the project more manageable.
- Proves the Concept: A successful data mart delivers a tangible return on investment, making it easier to get buy-in for future expansion.
This first project is your proof of concept. When the sales team starts hitting targets with clear, reliable data, other departments will want to get involved.
Prioritise Data Quality and Modern Tools
Even with a small start, data quality is non-negotiable. The ETL (Extract, Transform, Load) processes you set up for the first data mart must be solid. If the data isn't trustworthy, the insights are useless.
Thankfully, you no longer need a room full of expensive servers. Modern cloud platforms have made powerful data warehousing tools accessible and affordable.
Cloud-based solutions like Microsoft Azure Synapse Analytics or Snowflake run on a pay-as-you-go model. This lets you start with a small, cost-effective setup and scale up resources only as your data needs grow.
This scalability is a huge advantage, enabling enterprise-level data capabilities without the enterprise-level price tag. You can find more guidance in our article on how to choose the right data warehouse for your business. This flexibility ensures your data strategy can grow with your company.
A Phased Roadmap to Success
An incremental strategy is the right one for an SME. This phased approach strips away much of the risk.
Here’s a practical roadmap:
- Define a Core Business Problem: Pinpoint a high-impact question that needs a data-driven answer.
- Build a Pilot Data Mart: Focus on a single team (like sales or finance) to score a quick win.
- Launch Your First BI Dashboard: Connect a tool like Power BI to give that team immediate, actionable insights.
- Measure and Communicate Value: Show the ROI from the pilot to build internal support.
- Expand Incrementally: Once you've proven the value, move on to the next business area, building out your central warehouse one data mart at a time.
This iterative process ensures every step is grounded in real business value. The growth of data infrastructure in South Africa makes this modern approach more viable than ever. The local data centre storage market, valued at $460 million in 2024, is set to hit $800 million by 2032. This boom is fuelled by companies embracing cloud computing, making scalable solutions accessible. You can read the research on South Africa's data centre storage market trends. By starting small and scaling intelligently, any business can turn data into its most powerful asset.
Need a hand building a data roadmap that delivers results without breaking the bank? Contact DataSimplified to see how we can help you get started.
Frequently Asked Questions
Here are some common questions business leaders ask when exploring data warehousing.
How Much Does a Data Warehouse Cost for an SME?
The answer isn't a single number, but it’s more affordable than you might think. The days of large upfront investments in physical servers are gone. Cloud platforms like Microsoft Azure use pay-as-you-go pricing.
For an SME, starting costs could be a few hundred to a couple of thousand Rands per month. Costs grow as you add more data, so the model scales with you. A smart way to begin is by building a small, focused data mart for a single department. This proves the concept before you commit to a larger investment.
How Long Until We See Results?
You won’t wait years for a payoff. With a focused approach, you can see tangible results quickly. Building out a first data mart and connecting it to a tool like Power BI is often a project that takes a few months, not years.
The goal is to get a "quick win." As soon as one team experiences the power of having clean, automated reports, the value of the project becomes clear. That initial success creates the internal buy-in you need to expand.
Do I Need a Dedicated Technical Team to Manage It?
Not necessarily, especially when starting out. While building a data warehouse is a technical job, you don't have to hire a full-time in-house team right away. Many SMEs find it more practical to partner with a specialist data consulting firm.
This gives you immediate access to experts in ETL, data integration, and business intelligence without the long-term cost of new hires. A good partner handles the heavy lifting of setup and provides ongoing support, freeing up your team to use the insights to grow the business.
Need help building your next Power BI dashboard or data automation workflow? Contact DataSimplified to discuss how we can turn your business data into powerful insights.
