
Company data analytics turns the raw information your business generates into clear, strategic insights. It’s the process of transforming scattered data from sales, operations, and marketing into a roadmap for making smarter, evidence-based decisions that drive growth.
From Raw Data to Business Value
Imagine your customer records, sales figures, and operational data as uncooked ingredients. On their own, they don’t offer much. Company data analytics is the process that preps, combines, and transforms those ingredients into a clear strategy, showing you what's working, what isn't, and where your next opportunity lies.
For a South African SME, this isn’t a luxury reserved for large corporations; it's a fundamental tool for competing. It means you can stop relying on guesswork and start basing critical decisions on hard evidence from your own operations.
Why It Matters for Your Business
Data analytics provides concrete answers to crucial business questions. Instead of assuming which products are your bestsellers, you can see the exact sales figures. Rather than guessing why your customer support team is swamped, you can pinpoint the root causes.
This process lets you:
- Understand Customer Behaviour: Identify who your best customers are, what they buy, and how to keep them coming back.
- Optimise Operations: Find bottlenecks in your processes, reduce waste, and improve overall efficiency.
- Increase Profitability: Spot emerging trends, manage inventory more effectively, and focus your sales team's efforts where they will have the greatest impact.
The goal is to get a clear picture of your business's performance, powered by accurate, up-to-date information. A key part of this is what is business intelligence analytics, which focuses on presenting data in an understandable way.
A Growing Priority in South Africa
Local businesses are rapidly adopting data-driven strategies. The South African data analytics market was estimated at USD 1,016.3 million in 2024 and is expected to reach USD 2,758.9 million by 2030. This growth sends a clear message: companies are using data to gain a competitive edge.
For a mid-sized business, analytics transforms abstract numbers into actionable intelligence. It’s the difference between navigating with a compass versus a live GPS showing traffic, roadblocks, and the fastest route.
Ultimately, building a data analytics strategy creates a more resilient and proactive business. It provides the insights needed to adapt to market shifts, serve customers better, and build sustainable growth.
The Engine of Company Data Analytics
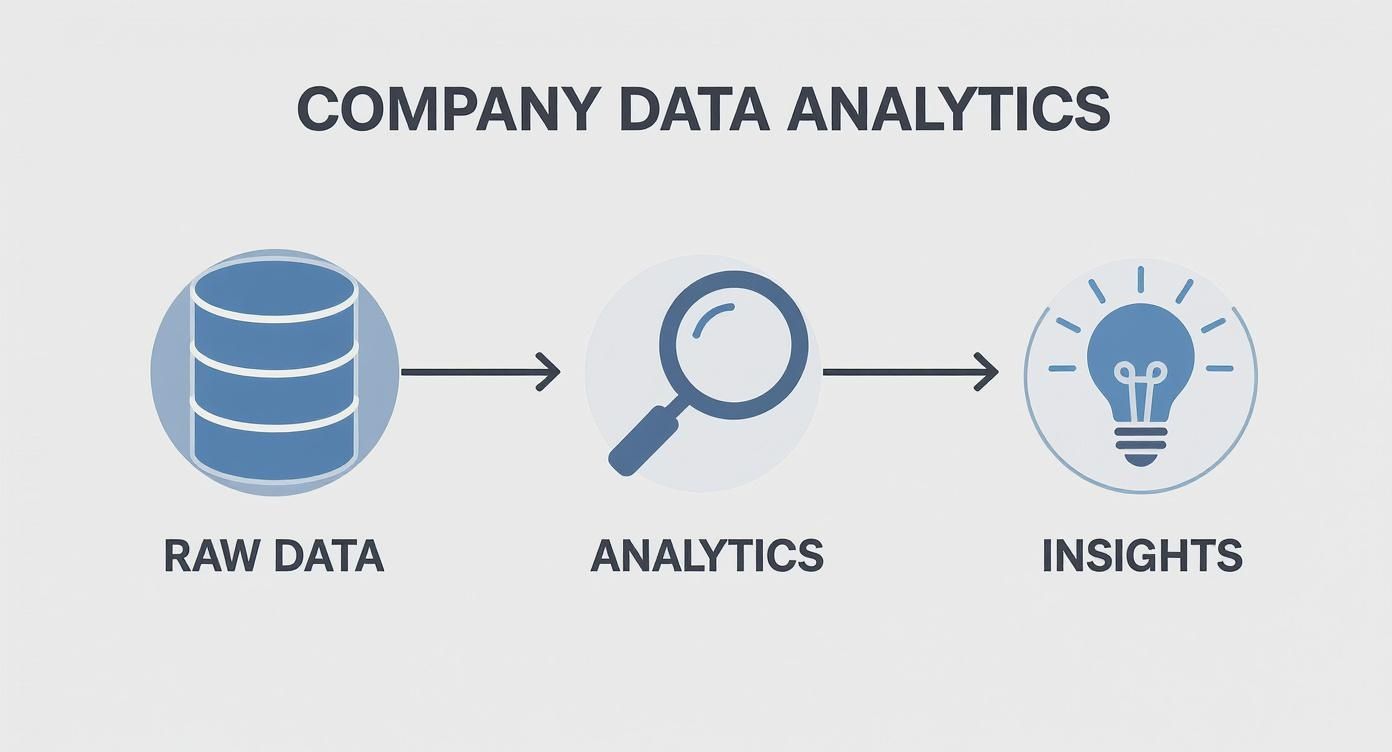
To get the most from company data analytics, it helps to understand the "engine" that powers it. This isn't about complex technical diagrams; it’s about following the journey your data takes from its raw, scattered state to a polished insight you can use.
Each stage has a specific job, working together to deliver business value. This structured pipeline ensures that every decision is based on a solid, well-managed data foundation.
Step 1: Data Ingestion
First is Data Ingestion—the process of gathering raw data from your different business systems. Think of it as collecting ingredients from various suppliers before starting to cook.
Your data is likely spread across multiple platforms:
- Financial Software: Systems like Xero or Sage hold your invoicing and expense records.
- Operational Systems: This could be your inventory management platform or job-tracking software.
- Customer Platforms: Your CRM, website analytics, or social media pages.
This step simply pulls everything into a central landing area, getting all the necessary information in one place.
Step 2: ETL – The Cleaning and Organising Phase
Raw data is usually messy—inconsistent, full of gaps, and not ready for analysis. The ETL (Extract, Transform, Load) process fixes this. It’s the essential prep work: standardising formats (like dates), correcting errors, removing duplicates, and structuring the data so it can be easily analysed.
This data engineering phase is critical. Skipping it means making decisions based on unreliable information.
A strong ETL pipeline is the unsung hero of data analytics. It ensures that every number in your final report is accurate and trustworthy—the foundation of confident decision-making.
This preparation means that when you ask, "What was our total revenue last quarter?", the answer is pulled from clean, validated data from every relevant source.
Step 3: The Data Warehouse
After being cleaned, the data is loaded into a Data Warehouse. Think of this as your business's central library—a highly organised place where all historical and current data is stored securely, ready for analysis.
Unlike a standard operational database that only stores current records, a data warehouse is built for reporting and analytics. It keeps a historical record, allowing you to track trends over time. For a growing South African business, this means you can analyse sales performance not just for last month, but for the last five years.
Step 4: Business Intelligence and Visualisation
The final stage is Business Intelligence (BI). Here, the prepared data from the warehouse is turned into something you can use. With tools like Microsoft Power BI, we create interactive dashboards and reports that bring the data to life.
Instead of staring at spreadsheets, you see clear charts and graphs that answer your most important business questions at a glance. You can explore how effective business intelligence and reporting services translate complex data into actionable insights. This step connects technical data work directly to business outcomes, allowing managers to spot trends, identify opportunities, and monitor performance in real-time.
Building a Practical Data Stack for SMEs
Knowing the theory of data analytics is one thing; building a system that works for your business is another. For many South African SMEs, the term "data stack" sounds complex and expensive.
The good news is you don’t need an enterprise-level setup to get results. A modern data stack is simply the combination of tools used to collect, store, process, and analyse information. The key is choosing technologies that are affordable, scalable, and solve your specific problems. It's about creating a streamlined pipeline that turns raw data into a competitive edge.
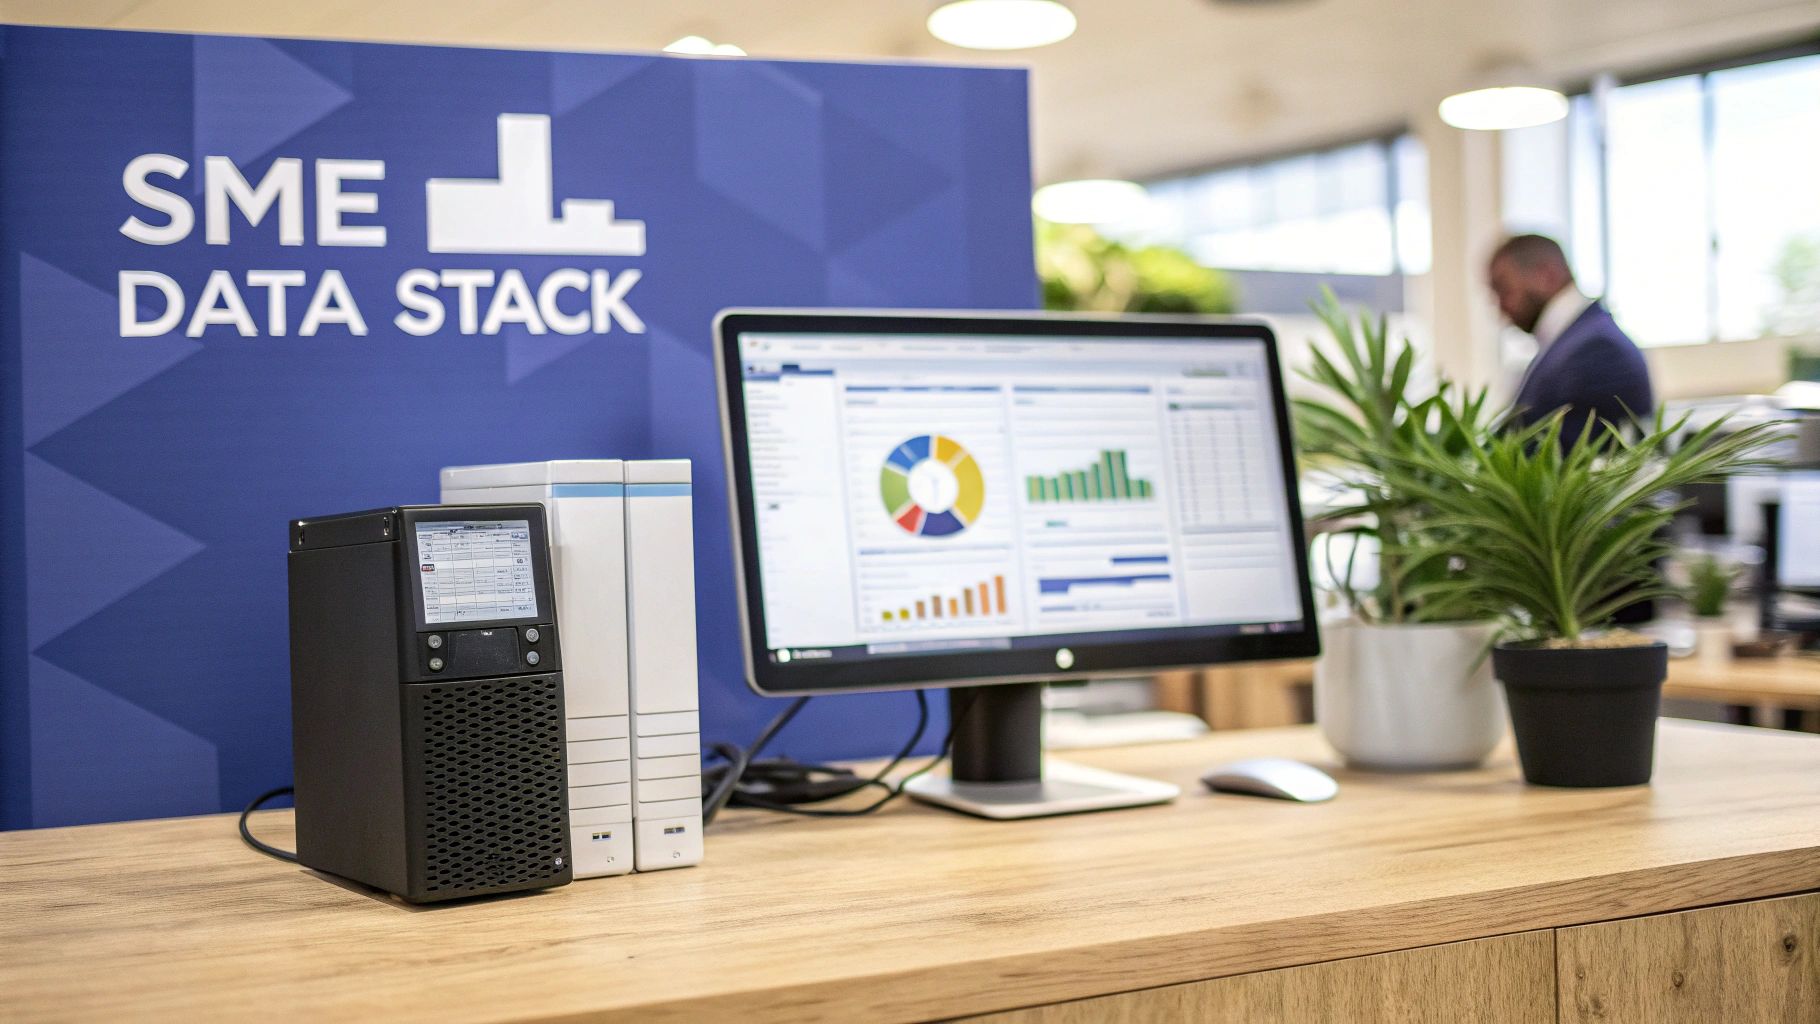
This kind of infrastructure is becoming essential. The South African data centre server market, the backbone for company data analytics, was valued at USD 1.9 billion in 2025 and is expected to hit USD 3.2 billion by 2030, showing how much local businesses are prioritising robust data processing.
Core Components of an SME Data Stack
An effective data stack for a growing business is about reliability and performance, not unnecessary complexity. Here’s a simple breakdown of a practical setup:
- Data Integration & ETL: This is the engine room. It automatically pulls data from sources like your CRM, accounting software, or spreadsheets and prepares it for analysis.
- Data Storage (Warehouse): This is your central library for clean, organised data, built for speed to make running queries and generating reports easy.
- Business Intelligence (BI): These are the user-friendly tools that create dashboards and reports, letting you see trends and find game-changing insights.
The foundation of it all is solid database management. Following key database management best practices is critical to ensure your data is secure, accurate, and ready to perform.
Example Technologies for a South African SME
Let’s talk about real tools. Building a powerful data stack doesn’t have to break the bank. Many SMEs achieve great results with proven, accessible technology.
For a growing business, the best data stack starts lean and scales with you. The priority should be delivering immediate value with tools that are both powerful and manageable.
A common and effective stack we implement for clients is built around the Microsoft ecosystem. The tools work together seamlessly and provide enterprise-grade power at a price point that makes sense for SMEs.
A Modern Data Stack for South African SMEs
Here's what a cost-effective, modern data stack could look like:
| Component Layer | Example Technology | Business Function |
|---|---|---|
| Data Integration | SQL Server Integration Services (SSIS) | Automates the ETL process, reliably pulling data from various systems, cleaning it, and loading it into your data warehouse. |
| Data Warehouse | Microsoft SQL Server | Provides a secure, scalable, and high-performance central database to store your structured business data for easy analysis. |
| Data Visualisation | Microsoft Power BI | Connects to your data warehouse to build interactive dashboards and reports, enabling you to monitor KPIs and uncover insights. |
This combination provides a complete, end-to-end solution for your company's data analytics. It’s a workhorse stack—powerful enough for serious data volumes but manageable for smaller teams or an external partner like DataSimplified.
How Analytics Drives Real Business Results
The real value of company data analytics appears when it solves everyday business problems. This is where data points transform into measurable improvements in profit, efficiency, and customer satisfaction. For SMEs, this is about making smarter, evidence-based decisions day in and day out.
Optimising Inventory for Retail Success
Consider a local retail business with several branches. They struggle with a classic problem: some stores are constantly sold out of popular items, while others have excess stock that won't move. Guesswork leads to lost sales and tied-up capital.
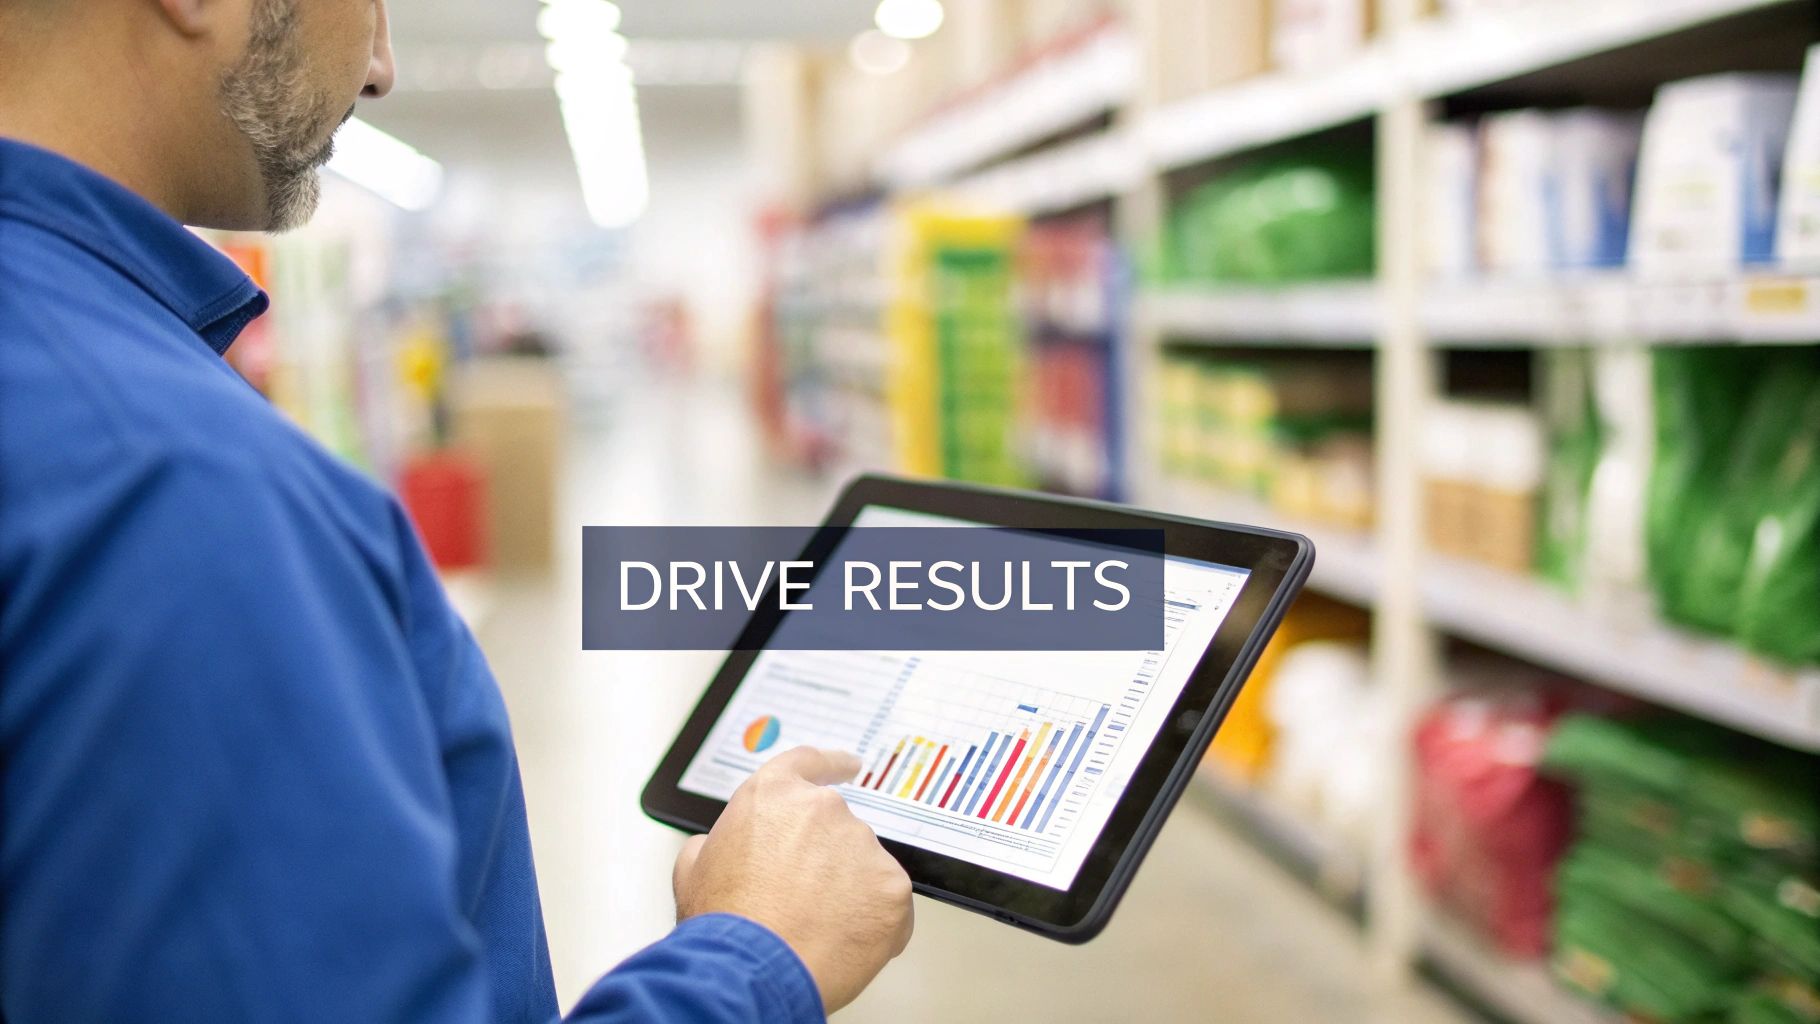
Company data analytics offers a direct solution. By pulling sales data from their point-of-sale (POS) system and linking it with inventory records, we can build a Power BI sales dashboard.
This gives them a clear, real-time view to answer crucial questions:
- Which products are top sellers at each location?
- What are the sales trends by day, week, or season?
- How quickly is stock selling through?
Armed with these insights, the manager can fine-tune stock levels, ensuring popular products are always available while cutting back on slow-movers. The result is increased sales, less waste, and better cash flow—a clear win powered by data automation and business intelligence.
Slashing Wait Times in Service Delivery
Now, imagine a logistics or repair company. Their reputation depends on efficiency. A major pain point is long customer wait times, but without data, they don't know why. Is it staffing, routing, or broken processes?
By analysing operational data—job logs, technician travel times, service records—we can uncover hidden bottlenecks. A custom dashboard can map the entire service delivery lifecycle.
Data analytics moves you from treating symptoms to curing the root cause. Instead of apologising for delays, you can re-engineer the process that creates them, building a stronger business.
The analysis might reveal that 25% of delays are caused by technicians arriving at jobs without the right parts. Or perhaps one area consistently has longer travel times. This insight allows the operations manager to implement targeted solutions, like better pre-dispatch checks or smarter route planning, leading to shorter wait times and happier customers.
Improving Lead Conversion for B2B Growth
Finally, picture a B2B company generating leads through its website. They have a decent flow of enquiries, but the conversion rate is low. The sales team feels they are working hard without seeing results because they lack visibility into their sales funnel.
This is a classic scenario where analytics makes a huge difference. By connecting data from their CRM system (like HubSpot) with website analytics, we can build a clear sales pipeline dashboard.
This dashboard highlights key metrics at every stage:
- Lead Source Performance: Which marketing channels bring in the most valuable leads?
- Conversion Rates: Where are most leads dropping off in the process?
- Sales Cycle Length: How long does it typically take to close a deal?
With this clarity, the sales manager might see that leads from a specific webinar convert at twice the rate of any other source, justifying more investment there. These data-driven tweaks can dramatically improve lead conversion and directly boost the company's bottom line.
Need help building your next Power BI dashboard or data automation workflow? Contact DataSimplified to discuss how we can turn your business data into powerful insights.
Your Roadmap to Implementing Data Analytics
Getting started with company data analytics doesn't have to be overwhelming. The key is a practical, phased approach: start small, show value quickly, and build momentum without a massive upfront budget. Focus on delivering tangible results from day one.
This roadmap is designed for SMEs. It’s about achieving quick wins and steady progress, not getting bogged down in complex, multi-year projects.
Step 1: Start with a Quick Win
Begin by tackling a single, high-impact business problem. This "quick win" project connects one data source to a basic Power BI dashboard to answer a specific, burning question.
Think about a pain point that comes up in meetings—getting a clear view of daily sales or tracking website leads. By focusing on one area, you can deliver a useful tool in weeks, not months. This immediately demonstrates the power of visualised data to decision-makers.
This first project is crucial because it:
- Delivers immediate, tangible value.
- Gets your team comfortable using data dashboards.
- Builds a solid business case for larger data projects.
Step 2: Identify Your Core Business Questions
With an initial success, it's time to think bigger. Work with your leadership and operational teams to define the most critical questions the business needs answered to grow. These questions become your Key Performance Indicators (KPIs).
A good business question is straightforward and linked to performance. For example:
- "Which of our services has the highest profit margin?"
- "What is our customer acquisition cost for each marketing channel?"
- "How is our on-time delivery rate changing month-to-month?"
Defining your KPIs is the most important step in building a data strategy. Without clear questions, you’re just collecting data. With them, every analysis has a purpose.
These questions become the blueprint for your analytics strategy, ensuring every dashboard and report is designed to provide actionable answers.
Step 3: Assess Your Current Data Sources
Now that you know what to measure, find where the answers are. Audit your existing business systems to map out all potential data sources. Most SMEs have valuable information scattered across platforms like accounting software, CRMs, and spreadsheets.
The goal is to get a clear picture of what data you have, where it lives, and its quality. This assessment will highlight any gaps and inform the data engineering work needed for your ETL and integration processes.
Step 4: Plan a Phased Implementation
Finally, create a phased plan that builds on your quick win. Prioritise data sources based on your business questions. Phase one might focus on sales and marketing data, while phase two brings in operational and financial information.
This iterative approach is central to successful company data analytics for SMEs. It keeps the process manageable, spreads the cost over time, and guarantees you deliver value at every stage. In South Africa, the adoption of business intelligence software is rising, with the market projected to hit US$127.19 million by 2030. This growth reflects a wider shift toward using data to work smarter, which a phased approach makes accessible to everyone. You can learn more by reading about the age of analytics from McKinsey's report.
Our analytics and consulting services are designed to guide you through each step, from planning to execution.
Common Data Analytics Pitfalls to Avoid
Starting a company data analytics initiative is a significant step, but the path has common traps that can derail your investment. Knowing these challenges is the first step toward building a data strategy that works.
Many businesses start with enthusiasm only to see projects stall. The most common mistakes relate to unclear goals, weak data foundations, and choosing the wrong tools.
Overlooking Data Quality
The biggest mistake is ignoring the quality of source data. You can build the most sophisticated Power BI dashboards, but if they run on inconsistent or incorrect information, they are worse than useless—they're actively misleading. It’s the classic “garbage in, garbage out” scenario.
Decision-makers will quickly lose trust in a system if the numbers look wrong. Before creating charts, a dedicated data engineering effort is needed to clean, standardise, and validate your information through a solid ETL process. Learn more in our guide on improving data quality for business success.
A data analytics project is only as strong as its weakest data point. Prioritising data integrity from day one isn't a best practice; it's the only way to build a system people will trust and use.
This upfront work in data automation and integration saves costly rework later and ensures the insights you generate are reliable.
Lacking Clear Business Objectives
Another common pitfall is starting an analytics project without a specific business problem to solve. Simply deciding to "become data-driven" is too vague. Without a defined goal, teams end up with dashboards that look nice but don't help anyone make better decisions.
Before starting, you must answer these questions:
- What specific outcome are we aiming for? (e.g., reduce customer churn by 5% or increase lead conversion by 10%).
- Which decisions will this analysis support? (e.g., where to focus the marketing budget or how to optimise stock levels).
- Who is this for, and what do they need to see? A sales manager needs a daily lead report; the CEO needs a high-level monthly KPI summary.
Starting with a clear "why" ensures your company data analytics project is focused on delivering a measurable return on investment.
Need help building your data automation workflows or Power BI dashboards? Contact DataSimplified to discuss how we can turn your business data into powerful insights.
Answering Your Data Analytics Questions
Considering data analytics for your business is a smart move, but it's normal to have questions about cost, people, and timelines. For SME owners in South Africa, getting straight answers is the first step toward making a confident decision.
Let's tackle the most common questions.
What will a data analytics solution cost my SME?
The cost is not a single, large number. It's a scalable investment designed to provide a solid return. You do not need a massive budget to start.
A better approach is to begin with a small, high-impact project, like a single Power BI dashboard tracking your most important sales KPIs. This way, you see tangible value almost immediately for a manageable initial cost. As your business grows, you can expand the solution by pulling in more data and building more sophisticated analytics. This phased approach avoids risky, oversized investments and ensures your spending is always tied to value.
Do I need to hire a full-time data analyst?
For most SMEs, hiring a full-time data analyst is not the most cost-effective option. Partnering with a specialist consultancy offers flexibility and a broad range of expertise.
When you partner with a consultancy, you get access to an entire team—data engineers to build the pipelines, BI specialists to create effective dashboards, and strategists to align it all with your business goals.
This model provides several key benefits:
- A Full Team of Skills: You get the right expert for the right job, from data integration and automation to dashboard design.
- No Long-Term Overheads: You avoid the costs of a permanent salary, benefits, and ongoing training.
- Flexible Support: You can scale our involvement up or down as your needs change, only paying for what you use.
How quickly will I see results?
Setting realistic expectations is key. The timeline depends on the project size, but a well-planned approach ensures you see value at every step.
An initial ‘quick win’ project, like a focused Power BI dashboard, can deliver actionable insights in just a few weeks. These early successes build momentum and show immediate value. Larger solutions, like building a data warehouse, are rolled out in phases over several months. This iterative approach means each stage delivers something functional, so you see progress and get benefits long before the entire project is finished.
Ready to turn your business data into a valuable asset? DataSimplified offers expert data engineering, business intelligence, and SaaS development to help South African SMEs make smarter, data-backed decisions.
Contact DataSimplified to discuss how we can turn your business data into powerful insights.
