Analytics and consulting turns the raw data your business collects into a clear, actionable plan for growth. For South African SMEs, this means partnering with experts to find the insights that drive efficiency, open new revenue streams, and create a genuine competitive edge.
Turning Your Business Data into a Strategic Asset
Many business owners are sitting on a mountain of data but don't know how to use it. Sales figures, operational logs, and customer feedback pile up in separate spreadsheets or systems, completely underused. Analytics and consulting builds a bridge between that raw information and smart, profitable decisions.
An analytics partner acts like a coach, studying performance data to map out a winning strategy. It’s not about complex theories; it's about applying practical, proven methods to your specific business challenges and goals.
What Does This Partnership Involve?
The goal is to shift your business from being data-rich but insight-poor to making confident, forward-thinking decisions. Instead of relying purely on gut feel, you base your strategy on what the numbers are telling you. A consultant helps you organise, analyse, and present this data in a way that is simple to understand and act on.
This hands-on process typically includes:
- Defining Business Goals: We start by clarifying what you want to achieve. Are you trying to cut operational costs, improve customer loyalty, or streamline your supply chain?
- Data Engineering: We then pull together and clean data from all your different sources—like accounting software, CRMs, and websites—using ETL (Extract, Transform, Load) processes to create a single source of truth.
- Building Intelligence: From there, we create easy-to-use Power BI dashboards and reports that put your key performance indicators (KPIs) and business trends front and centre.
- Ongoing Strategy: Finally, we provide expert guidance to help you translate these insights into practical, real-world business actions.
The Growing Importance in South Africa
The shift towards data-driven decisions is a significant local movement. The South African data analytics market is projected to grow from USD 1,016.3 million in 2024 to USD 2,758.9 million by 2030. Predictive analytics—forecasting what’s likely to happen next—already makes up over 40% of this market.
For SMEs, this is a massive opportunity. By embracing analytics, smaller businesses can react to market changes faster and more effectively than their larger, slower competitors.
Understanding modern approaches like Mastering Real-Time Data Analytics is crucial. It gives businesses the power to react to opportunities and threats as they happen. The goal is to unlock the potential of your company’s most valuable, and often most overlooked, asset—your data.
Your Analytics Journey: A Step-by-Step Guide
Starting with an analytics and consulting partner is a logical journey broken down into clear stages. The point is to build a practical tool you’ll actually use, not a static report that gathers dust.
A good analytics project follows a collaborative path from idea to finished product, like an architectural plan for a custom building. This ensures the final solution fits your business perfectly and adds value from day one.
Phase 1: Discovery and Strategy
This first phase creates the blueprint. Before looking at any data, we sit down with you to understand your business goals. What problems are you trying to solve? Are you looking to cut costs, find new sales opportunities, or reduce customer churn?
This stage is about asking the right questions to define success.
- Goal Alignment: We connect your business objectives to specific data points that will show progress. If your goal is to reduce customer churn, we’ll pinpoint the data needed to track churn rates and identify their causes.
- Data Source Identification: We map out where your crucial information is located. It could be in your accounting software, CRM, Excel spreadsheets, or operational logs.
- Defining the Scope: We agree on a clear, manageable scope for the first project, often a Minimum Viable Product (MVP). This approach delivers a valuable result quickly and builds momentum.
The most important outcome is a shared understanding of what we're building and why. This plan guides every subsequent step, ensuring the final Power BI dashboard or automation workflow directly answers your most pressing business questions.
Phase 2: Data Engineering and Preparation
With the blueprint signed off, it’s time to lay the foundation. This is the data engineering phase—the essential behind-the-scenes work required for accurate insights. Most businesses have data scattered across different systems and formats. Our job is to consolidate it into one clean, organised, and reliable source.
We use a process called ETL (Extract, Transform, Load). We extract raw data from its sources, transform it by cleaning it up and making it consistent, and then load it into a central data warehouse. This disciplined process ensures that when you look at a report, you can have complete confidence that the numbers are correct.
A solid data engineering phase is the difference between insights you can bet your business on and reports filled with questionable data. It turns messy, siloed information into a trustworthy asset ready for analysis.
Phase 3: Analysis and Visualisation
With a solid data foundation, we can now uncover the patterns, trends, and outliers hiding in your data. The goal is to move beyond seeing what happened to understanding why it happened.
The final step is translating these complex findings into intuitive and interactive Power BI dashboards. These are not just charts; they are dynamic tools that let you explore your business from every angle. With a few clicks, you can drill down from a high-level sales overview to the performance of a single product line or region. This makes data accessible to everyone on your team, empowering them to make smart decisions without needing a degree in statistics.
Need help turning your raw data into a clear, actionable strategy? Contact DataSimplified to see how our analytics process can build the insights your business needs.
The Core Technologies Driving Your Insights
You don't need to be a technology expert to get value from an analytics project, but understanding the basic tools helps. These technologies are the engine that turns raw data into clear business intelligence.
A solid analytics setup has a few key components that work together flawlessly. We handle the technical heavy lifting, but the concepts are straightforward. It's about improving data accuracy and report delivery, allowing you to ask bigger, more valuable questions.
This infographic breaks down the typical journey from discovery to visualisation.
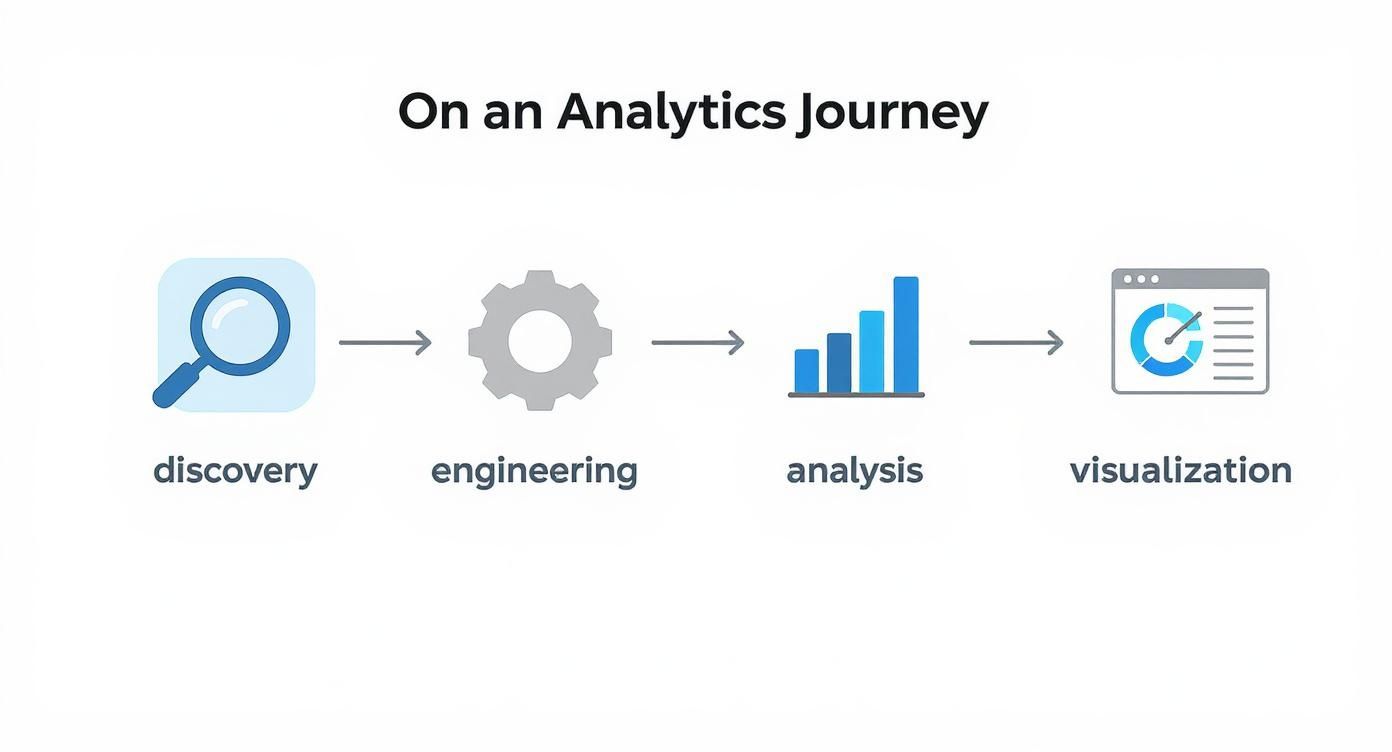
As you can see, technology is the backbone of each stage, from preparing your data to presenting the final insights in a way everyone can understand.
ETL and Data Warehousing: The Foundation
The first and most important process is ETL (Extract, Transform, Load). Think of it like a professional chef prepping ingredients. Raw ingredients (your data) are gathered from different suppliers (your software systems), prepared (transformed), and then neatly organised in the pantry (loaded into a data warehouse).
This prep work is crucial for data integrity. It ensures information from your sales CRM lines up with your accounting package. Without a proper ETL process, you risk making decisions on incomplete or incorrect data.
This prepared data lives in a data warehouse—your business's single source of truth. No more hunting through dozens of spreadsheets; everything is organised, secure, and ready for analysis. This centralised approach is the bedrock of any serious business intelligence effort.
Visualisation and Integration Tools: Making Sense of It All
Once your data is clean and organised, you need a way to understand it. That's where tools like Microsoft Power BI shine. Power BI connects to your data warehouse and transforms numbers into interactive, visual dashboards. Suddenly, you can explore sales trends, spot operational bottlenecks, and track key metrics with a few clicks. We've written a detailed guide on how Power BI can transform your business intelligence.
Behind the scenes, integration tools like SQL Server Integration Services (SSIS) automate the flow of data between your systems. This eliminates tedious manual data entry and reduces the risk of human error, keeping your dashboards populated with fresh, up-to-the-minute information. These technologies power solutions like these business process automation examples for SMEs.
This table breaks down the key technologies and what they do for your business.
Key Analytics Technologies and Their Business Purpose
| Technology / Concept | What It Does (Simple Terms) | Why Your Business Needs It |
|---|---|---|
| ETL (Extract, Transform, Load) | Collects, cleans, and organises raw data from all your different software systems. | Ensures your data is accurate, consistent, and trustworthy before you use it for reports. |
| Data Warehouse | A central, secure storage hub for all your clean, organised business data. | Creates a single source of truth, ending reliance on scattered spreadsheets and siloed info. |
| Microsoft Power BI | A tool that turns complex data into easy-to-understand interactive charts and dashboards. | Helps you visualise trends, track performance, and share insights across your organisation easily. |
| SSIS/SSAS/SSRS | A suite of tools that automates data movement, prepares data for analysis, and builds reports. | Automates manual reporting tasks, reduces errors, and ensures your data is always ready for analysis. |
| Ab Initio / CloverDX | Specialised, powerful platforms for managing complex ETL and data integration tasks at scale. | For larger organisations that need to handle massive volumes of data from many diverse sources reliably. |
When you combine robust data prep (ETL), a central library (data warehouse), and intuitive dashboards (Power BI), you build a powerful system that delivers reliable insights, every time.
The need for these skills is growing. South Africa's ICT sector, which supports the broader consulting market, is forecast to reach USD 58.09 billion by 2030. This growth shows that investing in the right technology is essential for staying competitive.
How South African SMEs Win with Data
Seeing real-world results is what truly matters. The power of data analytics comes to life when you see it working for businesses like yours. Across South Africa, small and mid-sized enterprises are using data to gain a serious competitive edge.

These are not stories about massive corporations with unlimited budgets. They are practical examples of how focused data strategies deliver tangible returns, helping local companies work smarter, cut costs, and grow faster.
Let's look at a couple of scenarios that show what’s possible.
Case Study 1: The Cape Town Retailer
An independent retail store in Cape Town was dealing with a common problem: chaotic busy periods and wasteful quiet times. They relied on gut feel for staff scheduling, which meant they were often overstaffed during lulls and overwhelmed during rushes, hurting both sales and customer service.
The Business Challenge:
How could they match staffing levels to actual customer foot traffic to capture every sales opportunity without overspending on wages?
The Analytics Solution:
We implemented a straightforward data project. We connected data from their point-of-sale (POS) system with simple foot-traffic counters. This information was fed into a custom Power BI dashboard that showed sales, transactions, and customer entries by hour and day.
The Measurable Outcome:
Within two months, the patterns became clear. The dashboard revealed their busiest period was between 4 PM and 6 PM on weekdays, not lunchtime as they had assumed. It also highlighted a significant traffic spike on the third Saturday of each month. Armed with this insight, they reworked their staff rotas. By aligning staff with peak times, they achieved a 12% increase in average transaction value and a noticeable improvement in customer feedback.
Case Study 2: The Gauteng Logistics Company
A mid-sized logistics company in Gauteng was battling thin margins and rising fuel costs. Their experienced drivers planned routes based on habit, not data, leading to wasted kilometres and time stuck in traffic.
The Business Challenge:
They needed to cut fuel consumption and improve delivery times to remain profitable. A data-driven way to optimise routes was essential.
This is a perfect example of moving from reactive problem-solving to proactive optimisation. Instead of just absorbing rising costs, the business used data to fundamentally change how it operated, directly protecting its bottom line.
The Analytics Solution:
We initiated a data integration and automation project. We pulled GPS tracking data from their vehicle fleet and combined it with delivery schedules and live traffic data. An ETL process was built to clean and structure this information daily. The result was a dashboard that visualised route efficiency, idle times, and fuel consumption for every vehicle.
The Measurable Outcome:
The analysis quickly identified several inefficient routes with predictable traffic jams. By adjusting departure times—sometimes by as little as 30 minutes—and rerouting vehicles based on traffic predictions, the company achieved a 15% reduction in fuel costs within six months. That saving went straight to their bottom line.
You can learn more about our approach in our article on empowering SMMEs through data.
These local stories prove that analytics is a practical tool for solving real business problems. The secret is to start with a specific challenge, apply the right data and intelligence techniques, and focus on achieving a measurable result.
Choosing the Right Analytics Partner
Picking the right analytics and consulting firm is a critical decision. This isn't just hiring a service provider; it's finding a partner who will guide you through the technical process and ensure the solution delivers real business value.
For a South African SME, this choice is even more important. You need a partner who understands the local market, the pressures you face, and can deliver enterprise-level results without the enterprise price tag. You're looking for a strategic ally, not just a coder.
Look Beyond the Sales Pitch
A slick presentation full of buzzwords means little. The measure of a great partner is their ability to speak the language of business as fluently as they speak tech. They should ask more about your operational challenges and revenue targets than they boast about their software stack.
A consultant who understands your business model can connect a technical tool, like a Power BI dashboard, to a real-world outcome, like reducing stock holding costs. That business-first approach is essential.
The right partner doesn’t just build what you ask for; they challenge your assumptions and help you discover what you truly need. They are invested in your success, not just in completing project tasks.
Key Criteria for Selecting Your Partner
As you talk to potential partners, use this checklist to separate the experts from the technicians.
- Proven Local Experience: Have they worked with South African businesses like yours? Local context is critical.
- Focus on Scalable Solutions: A smart partner will suggest starting small with a high-impact solution, like a single dashboard or a lean SaaS MVP. This delivers a quick win and sets a foundation for future growth.
- Technical and Business Fluency: Can they speak effectively with both your CEO and your IT lead? This dual skillset is non-negotiable.
- A Clear, Phased Approach: They should be able to outline a clear plan, from discovery and data engineering through to dashboard delivery and ongoing support.
- Transparent Communication: You want a partner who provides regular updates and is upfront about any challenges.
We dive deeper into this in our guide on how to choose the right data services outsourcing partner.
Understanding the Local Consulting Landscape
The South African consulting scene is evolving to meet the needs of a dynamic economy. There is a growing demand for partners who combine deep local knowledge with global-standard technical skills. Hubs like Johannesburg and Cape Town are at the centre of this trend, where a booming digital economy fuels the need for specialised analytics consulting.
Choosing a partner comes down to trust and a shared vision. You're looking for a team with the technical skills to handle your data engineering and build insightful Power BI dashboards, who also genuinely wants to see your business succeed.
Measuring the ROI of Your Analytics Project
An analytics project is a strategic investment, not just an expense. Like any investment, you must be able to measure its return. We need to move beyond vague benefits like "better insights" and focus on metrics that impact your bottom line.
The real test of an analytics project is when it stops being a cost centre and starts driving profit. This happens when every dashboard and automated process is directly linked to a specific, measurable financial outcome. Proving this value is what turns a one-off project into a long-term data strategy.
Identifying Key Performance Indicators
The first step in calculating your return on investment (ROI) is to define what you're trying to improve. Before any work begins, we establish baseline metrics. This provides a clear "before" picture to compare against once your new analytics solution is running.
Common areas where we measure ROI include:
- Cost Savings: This is often the most direct metric. Examples include identifying inefficient delivery routes to cut fuel costs or optimising stock levels to reduce capital tied up in warehousing.
- Revenue Growth: Analytics uncovers hidden opportunities, such as pinpointing your most profitable customer segments for a targeted marketing campaign or identifying cross-selling opportunities.
- Operational Efficiency: This measures the time and resources saved through data automation. For example, we track the reduction in hours spent manually compiling weekly reports after implementing an automated Power BI dashboard.
Tangible vs. Intangible Returns
While hard numbers secure budget approval, not all benefits appear immediately on a spreadsheet. A great project delivers both tangible and intangible returns.
A successful analytics project delivers more than just financial gains. It fosters a culture of data-driven decision-making, reduces reliance on guesswork, and boosts team morale by empowering staff with the information they need to succeed.
For instance, a tangible return is a 10% reduction in marketing spend by focusing only on high-performing channels. The intangible return is the newfound confidence and speed with which your leadership team makes critical decisions—valuable, but harder to price.
A well-executed analytics engagement should pay for itself many times over. By focusing on concrete outcomes from day one, you can demonstrate how turning raw data into insight builds a more resilient and profitable business.
Need help building an analytics solution with a clear and measurable return on investment? Contact DataSimplified to discuss how we can turn your business data into powerful insights.
Common Questions About Analytics Consulting
Deciding to invest in analytics and consulting is a big step, and it's normal to have questions. Business owners often voice concerns about cost, complexity, and readiness. Let's address some of the most common myths.
Our Company Data Is a Mess. Is It Too Early for Analytics?
No, this is the perfect time to start. Nearly every business begins with messy, disorganised data. A major part of any analytics project is data engineering—the process of turning that chaos into a structured, reliable asset.
Through a process called ETL (Extract, Transform, Load), a consultant cleans and organises your data. Often, valuable insights emerge during this clean-up phase alone.
How Long Will a Typical Analytics Project Take?
The timeline depends on the scope, but the goal is always to deliver value quickly. A focused, foundational project—like building a sales performance dashboard in Power BI—can often be delivered in just a few weeks.
We believe in an agile approach. We start with a high-impact Minimum Viable Product (MVP) that gets you tangible results fast. This builds momentum and allows real successes to guide the next steps.
Is This Kind of Consulting Only for Big Corporations?
This is a common myth. Modern tools and scalable cloud platforms have made powerful analytics affordable for SMEs. The key is to partner with a firm that builds lean, practical solutions that fit your budget and business needs. You don't need a massive, expensive enterprise system. A focused approach delivers better results for a fraction of the cost.
Do We Need an In-House Technical Team to Manage This?
Not at all. The purpose of bringing in a consulting partner like DataSimplified is to provide that expertise. We handle the entire technical process, from data engineering and integration to building dashboards and providing ongoing support. This frees up your team to focus on using the insights to make smarter decisions and grow the business.
Need help building your next Power BI dashboard or data automation workflow? Contact DataSimplified to discuss how we can turn your business data into powerful insights.
Article created using Outrank