
Business leaders often use "reporting" and "business intelligence" interchangeably, but they are not the same. Understanding this difference is the first step in building a business that runs on data, not just collects it.
At its core, the distinction is simple. Reporting tells you what happened. Business Intelligence (BI) helps you understand why it happened and what you should do next. Reporting is looking in the rearview mirror; BI is the GPS guiding your next turn.
Reporting vs. BI: What's the Real Difference?
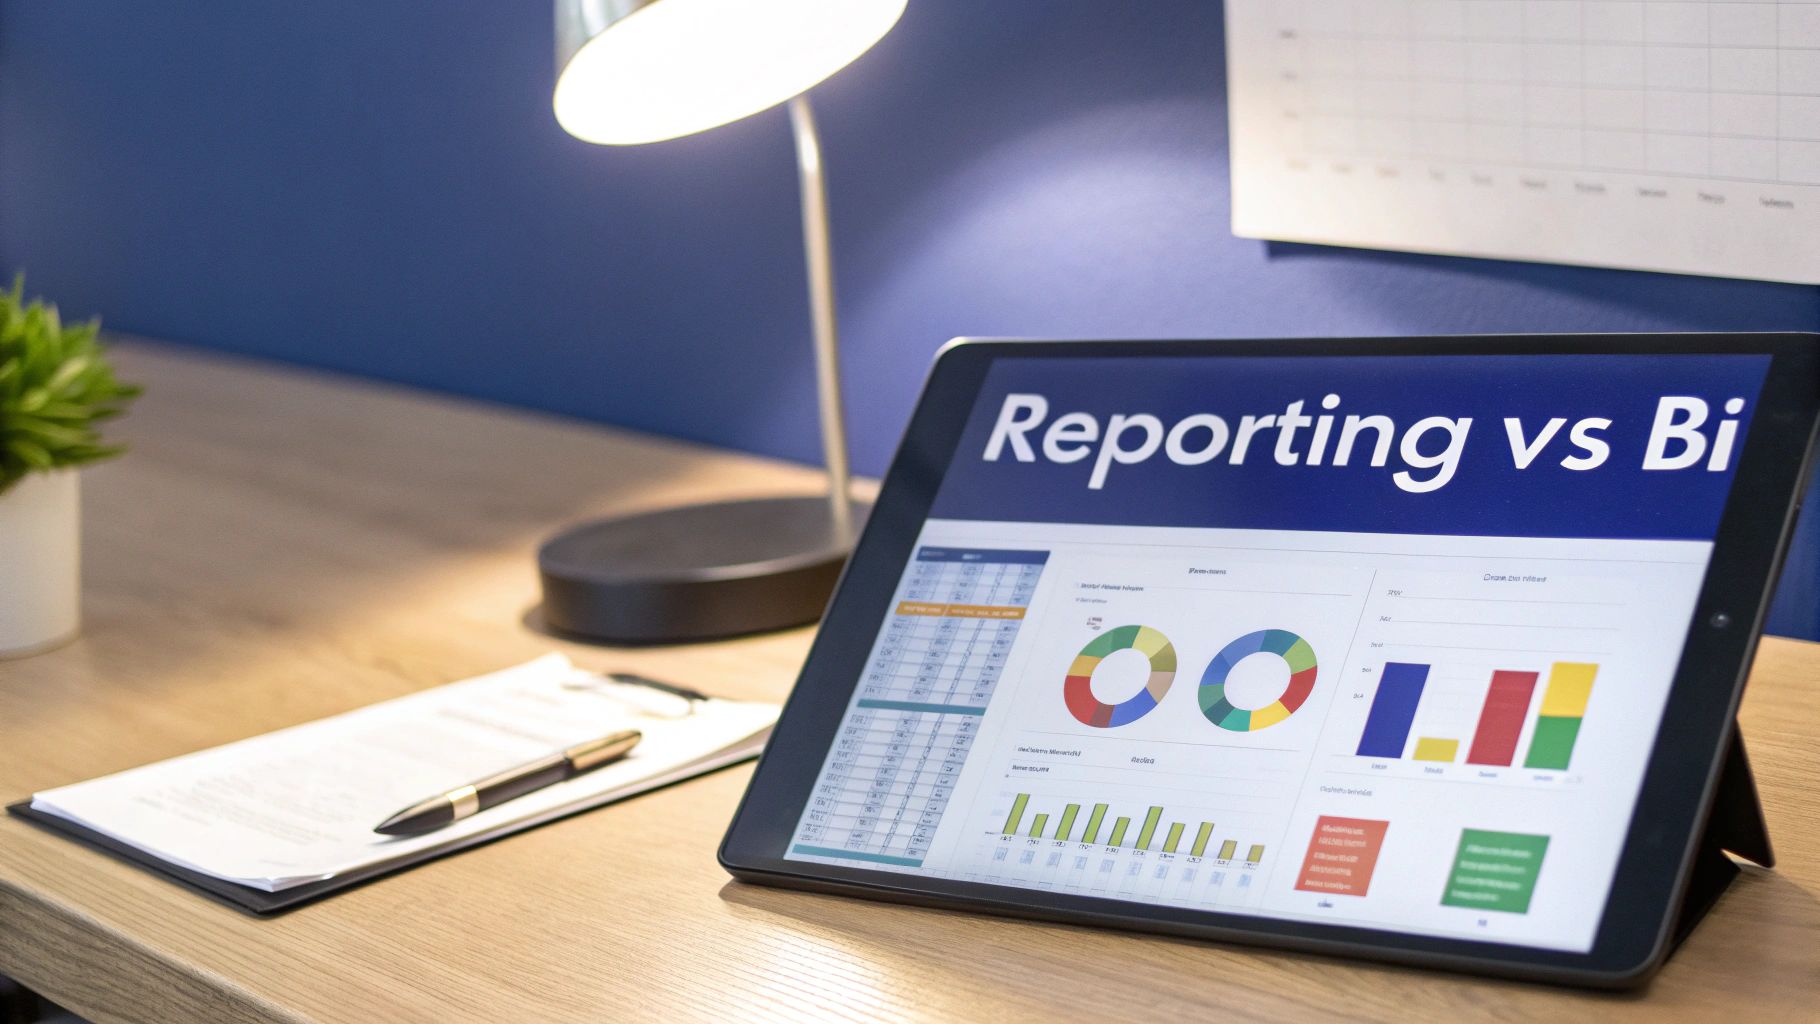
Reporting is the process of organising data into digestible summaries. It’s a fundamental business activity for monitoring performance. The key characteristic is that reports are typically static and look backwards.
You are already familiar with these kinds of reports:
- Monthly Sales Reports: A list of sales figures by product or region for the previous month.
- Financial Statements: A standard profit and loss statement or balance sheet summarising past financial activity.
- Operational Summaries: A daily rundown of production output or call centre wait times.
These reports are essential. They answer specific, pre-defined "what" questions and are perfect for operational oversight. But they don't tell the whole story.
The Shift from "What" to "Why"
This is where Business Intelligence comes in. BI is a dynamic, interactive process, not a static document. It takes you beyond the raw numbers to help you understand the drivers behind them. Modern BI tools, like a Microsoft Power BI dashboard, are built for this kind of exploration. You can drill down into data, apply filters, and ask follow-up questions you hadn't considered.
Instead of just seeing a report showing total sales, a BI dashboard lets you dig in. You can start asking, "Why did our sales in KwaZulu-Natal jump by 15% after that marketing campaign, while sales in the Western Cape stayed flat?"
BI transforms data from a passive record of the past into an active tool for strategic planning. It empowers business leaders to move from observation to action by uncovering trends, patterns, and opportunities that static reports would miss.
Here’s a side-by-side comparison for a clearer picture.
Reporting vs. Business Intelligence at a Glance
| Aspect | Reporting | Business Intelligence (BI) |
|---|---|---|
| Purpose | To inform and monitor past performance. | To explore, analyse, and guide future strategy. |
| Focus | "What happened?" | "Why did it happen?" and "What's next?" |
| Nature | Static, summarising past data. | Dynamic, interactive, and exploratory. |
| Questions | Answers pre-defined questions. | Allows for ad-hoc, open-ended questions. |
| Output | Static reports, PDFs, spreadsheets. | Interactive dashboards, visualisations, forecasts. |
| User Role | Passive consumer of information. | Active explorer of data. |
This interactive approach creates a more proactive culture. Instead of reacting to last month's numbers, your team can start spotting market shifts and making informed, forward-looking decisions. It’s the difference between documenting your journey and actively steering the ship.
The goal of BI is to deliver actionable insights that drive real growth and efficiency. This all hinges on a solid data engineering foundation to ensure the information you're exploring is accurate, timely, and trustworthy.
Need help building your next Power BI dashboard or data automation workflow? Contact DataSimplified to discuss how we can turn your business data into powerful insights.
Why BI is Essential for South African Businesses
In South Africa, Business Intelligence is no longer just for large corporates. It's a fundamental tool for survival and growth for businesses of all sizes. Local companies face a unique mix of economic pressures and competition.
Consider a logistics firm in Durban trying to streamline its supply chain, or a Cape Town retailer wanting to understand customer spending habits. The common thread is the need for data-driven agility.
Making decisions on gut feel is a risky gamble. Your competitors are likely already digging into their data to find cost savings and new market opportunities. BI gives you the power to move beyond basic historical reports to a more forward-thinking, strategic approach. It helps you get answers quickly so you can react to market changes before they become major problems.
Navigating Local Economic Realities
For many SMEs, the push towards BI is about efficiency. The goal is to do more with less—optimising stock levels, smoothing out operational workflows, or improving marketing ROI. A well-built Power BI dashboard can instantly highlight waste or opportunity that would otherwise stay buried in complex spreadsheets.
Market trends confirm this. The demand for BI and reporting tools is rising because they deliver measurable returns. South Africa's Business Intelligence Software market recently hit a revenue of US$107.37 million, a growth fuelled by companies determined to make smarter, data-backed decisions. Learn more about the growth of BI software in South Africa.
Gaining a Competitive Edge
Beyond internal efficiency, BI offers a significant competitive advantage. When you understand your customers, products, and services on a deeper level, you can create more value and stand out from the crowd.
A proactive data strategy is no longer a luxury but a core business function. It equips you with the insights needed to not only compete but also to lead in your specific industry.
Expert BI and analytics consulting can be a game-changer. You move from tracking what happened to predicting what might happen next, allowing you to shape your business strategy with confidence.
BI helps you get ahead in several key areas:
- Customer Segmentation: Pinpoint your most profitable customer groups and tailor your offerings to their needs.
- Operational Optimisation: Identify process bottlenecks to cut costs and improve service delivery.
- New Market Identification: Analyse sales data to uncover untapped regions or customer segments ripe for growth.
By putting BI to work, South African businesses can transform raw data into one of their most powerful assets, ensuring they are ready for future challenges and opportunities.
Reporting vs. BI: Choosing the Right Tool for the Job
So, you have data. The question is not whether reporting is better than BI, but which tool to use for a specific business challenge. It's about having a well-stocked toolbox—you wouldn't use a sledgehammer to hang a picture frame.
Reporting is for your operational rhythm. It’s for consistent, scheduled check-ins to monitor business health. Use it to maintain stability, prove compliance, and track progress against set goals.
BI, on the other hand, is your discovery engine. Use it for strategic, exploratory missions. BI helps uncover "aha!" moments, untangle complex market trends, and tackle forward-looking questions without neat answers. It’s for asking ‘what if’ and digging into the ‘why’.
When Standard Reporting is Your Best Bet
Stick with standard reports when you need straightforward, factual answers to routine business questions. These are typically static snapshots of historical data designed for a consistent view of operational health.
Here are scenarios where reporting shines:
- Monthly Financial Statements: Generating the profit and loss, balance sheet, and cash flow statements for the last month. No deep analysis, just the facts.
- Daily Call Centre KPIs: Tracking metrics like call volume, average handle time, and first-call resolution to monitor daily efficiency.
- Compliance Documentation: Producing auditable records for health and safety incidents or financial reviews during an audit.
- Weekly Stock Level Summaries: A simple list showing current stock against reorder points to manage procurement.
These tasks demand accuracy and consistency. The goal is to monitor known important metrics, not to hunt for new ones.
Think of reporting as the regular health check for your business. It’s like taking its temperature and blood pressure—giving you the vital signs you need to make sure everything is ticking along as it should be.
When it's Time to Unleash Business Intelligence
When you need to understand what’s driving your performance, it’s time for BI. Tools like interactive Power BI dashboards are built for this, letting you slice, dice, and drill down into your data to uncover the story behind the numbers.
Deploy BI when tackling more strategic goals, such as:
- Analysing Customer Lifetime Value: Combining sales, marketing, and service data to identify your most valuable customers and understand why they stay loyal.
- Modelling New Product Profitability: Forecasting revenue and costs for a new product launch by analysing historical sales patterns and market data.
- Investigating Supply Chain Bottlenecks: Visually mapping logistics data to pinpoint exactly where delays are happening and what is causing them.
BI is perfect for situations where questions are open-ended and answers require blending data from different parts of the business. It transforms your data from a static archive into a dynamic asset that fuels strategic decisions.
Need help building your next Power BI dashboard or data automation workflow? Contact DataSimplified to see how we can turn your business data into powerful, actionable insights.
Building the Data Foundation for Reliable Insights
Behind every powerful dashboard and accurate report is a solid data foundation. This is the essential, behind-the-scenes work of data engineering. Without it, a new Power BI dashboard is little more than a collection of pretty but unreliable numbers.
For most SMEs, valuable data is scattered across different systems that don’t communicate—a CRM like Salesforce, accounting software like Xero, and numerous spreadsheets. The first step is to build the 'plumbing' to pull this data into one clean, organised place. This process ensures that your dashboard delivers trustworthy insights.
From Raw Data to Actionable Insight
At the heart of this foundation is a three-step process called ETL (Extract, Transform, Load). It’s a powerful framework for building a functional data pipeline.
- Extract: We pull data from all its sources—your CRM, financial software, marketing platforms, and other applications.
- Transform: The raw data is cleaned, standardised, and organised. We fix inconsistencies, remove duplicates, and structure it for analysis.
- Load: The clean, structured data is loaded into a central repository, usually a data warehouse, where it’s ready for analysis.
For a reliable data foundation, mastering Salesforce CRM integration is a non-negotiable step toward unifying your data. This groundwork separates a confusing, untrustworthy dashboard from a game-changing business tool.
A well-designed data pipeline automates the tedious, error-prone manual work of data preparation. It creates a single source of truth, ensuring everyone in your business makes decisions based on the same accurate, up-to-date information.
This journey from static documentation to dynamic intelligence is a fundamental shift in strategy.
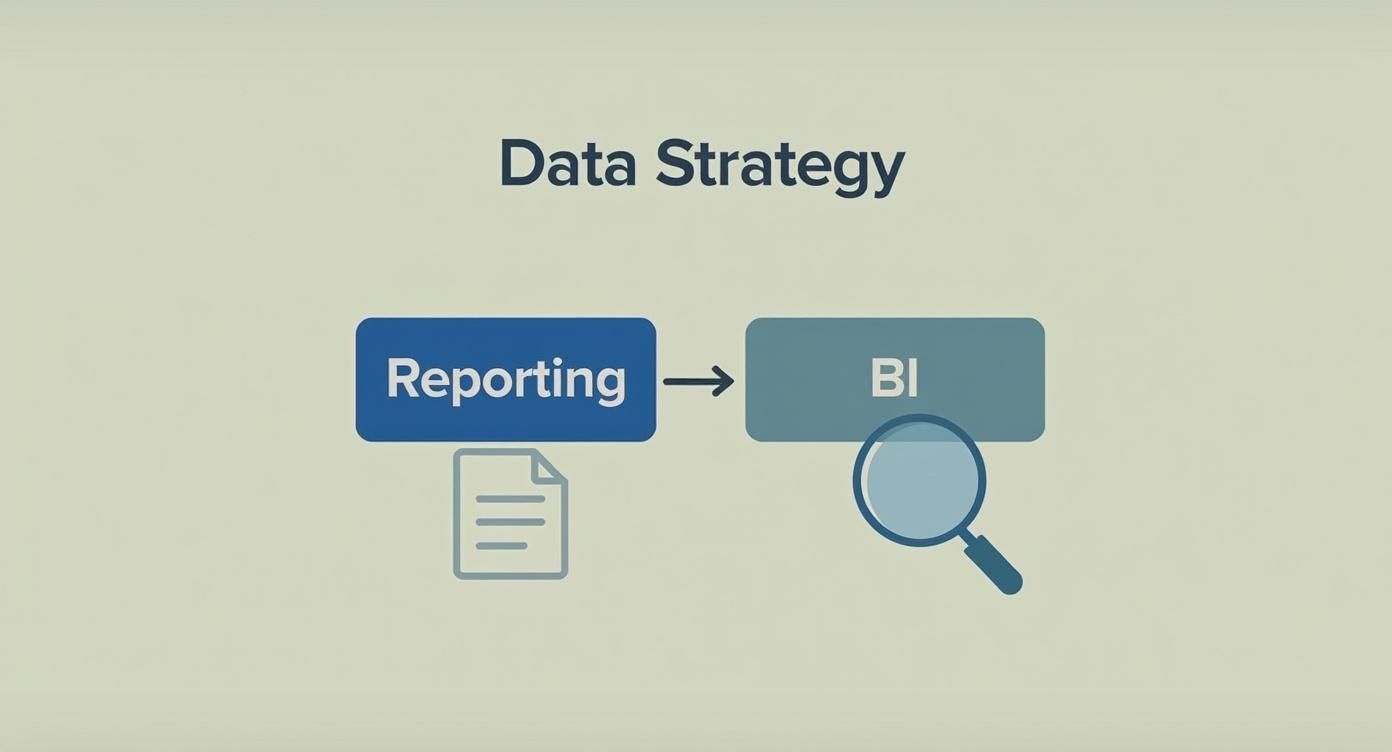
It’s about moving beyond recording what happened (reporting) and starting to actively explore why it happened (business intelligence).
Why Data Quality Cannot Be an Afterthought
Skipping the data foundation is a common and costly mistake. While the global BI market was recently valued at over USD 30 billion and continues to grow, a staggering 71% of companies admit their BI tools are struggling. The main culprit is poor underlying data structures.
Bad data leads to bad business decisions. If the information feeding your BI and reporting tools is messy, inconsistent, or wrong, the "insights" you get will be flawed. This erodes trust across the organisation until no one believes the numbers.
Investing in solid data engineering and actively improving data quality for business success isn't a technical luxury. It is an absolute necessity for any business serious about making smart, data-driven decisions.
Choosing the Right Tools: Power BI for South African SMEs
For a South African SME, picking the right tool for BI and reporting is a critical decision. You need something powerful enough for real insights, affordable enough to make sense, and simple enough for your team to use. This is where Microsoft Power BI excels, hitting the sweet spot between sophisticated features and practical usability.
A major benefit of Power BI is its seamless integration with tools your team already knows. Many businesses run on Microsoft Excel. Power BI feels like a natural upgrade, letting staff use their existing spreadsheet skills to create data visualisations and automated reports. This familiarity reduces training time and increases user adoption.
Of course, it's wise to review your options. A good business reporting tools comparison can provide a clear picture of how different platforms stack up, helping you evaluate everything from data connectivity to dashboard customisation.
Local Infrastructure for Better Performance
Microsoft's direct investment in South African data centres is a game-changer for local businesses. This addresses major concerns like processing speed, lag, and data sovereignty.
Power BI established its first available region in Africa through the South Africa North region in Johannesburg. This allows customers to locate their BI deployments closer to their data sources, resulting in faster data refresh performance and lower networking costs.
This means your data isn't sent halfway across the world and back. Your dashboards load faster, reports refresh quicker, and you can make critical decisions based on the most up-to-date information.
Empowering Your Team with Data
The purpose of a BI tool is to put valuable insights into the hands of the people who can act on them. Power BI is designed to be used by everyone, not just data scientists.
With its intuitive drag-and-drop interface, your operations manager or sales lead can build their own reports and explore data for themselves. This fosters a genuine data-driven culture. Instead of waiting for IT to pull a report, your team can ask their own questions and find their own answers, sparking faster innovation and problem-solving.
By connecting directly to the data sources you already use—from your accounting package to your CRM—Power BI brings everything into one interactive hub. To learn more, read about transforming business intelligence with Power BI and see what it could do for your organisation.
Need a hand building your first Power BI dashboard or setting up a data automation workflow? Contact DataSimplified to chat about how we can turn your business data into your biggest asset.
So, What’s Your Next Move?
Knowing the difference between reporting and BI is one thing; putting that knowledge into practice is where the real value lies. The principle is simple: use reporting to monitor business operations and use BI to plan for growth.
The first step is to take an honest look at where you are now. Ask yourself a few straightforward questions to highlight your biggest challenges and opportunities, giving you a clear starting point.
A Quick Self-Assessment
Consider these three things to identify what you need most:
- Where is my most important business data stored? Is it in one system, or scattered across spreadsheets, your CRM, and accounting software?
- If I could get an answer to one strategic question, what would it be? For example, “Which of our marketing campaigns brings in the most profitable customers?” or, “Where are the invisible hold-ups in our supply chain costing us money?”
- How many hours do my people waste each month copying and pasting data to build reports? Automating this manual work is often the lowest-hanging fruit and can deliver an immediate, massive win.
Your answers create a clear roadmap. They will tell you whether your first project should be organising your data foundation, building a BI dashboard in Power BI to explore the unknown, or simply automating existing reports.
Stuck on how to build that first dashboard or automate a clunky workflow? Get in touch with us at DataSimplified. We can help you turn scattered business data into a real competitive advantage.
Your Questions, Answered
Here are a few common questions we get from South African business owners about business intelligence and reporting.
"Is something like Power BI too complicated for my small business?"
No. While Power BI is a powerful tool, its interface is intuitive, especially for anyone comfortable with Excel. The key is to start smart: begin with a clear goal and a clean data source.
A partner can handle the tricky data engineering in the background and set up the initial dashboards. This leaves your team free to explore insights and use the data without needing to be technical experts.
"What does a typical BI project cost a business like mine?"
The cost depends on the complexity of your data sources and dashboard requirements. Modern cloud tools have made BI much more accessible and affordable for smaller companies.
The modern approach avoids a massive upfront investment. We start with a single, high-impact project—like a sales or operations dashboard—and build from there. Our goal is to provide enterprise-level insights without the enterprise price tag, focusing on what your business needs most right now.
"We already use Excel for reports. Why would we need BI?"
Excel is excellent for static reports. However, it struggles with large datasets, real-time updates, and interactive analysis. Business intelligence tools like Power BI are built for these challenges. They automate the data refresh process, which reduces manual work and eliminates human error.
The real leap forward with BI and reporting tools is shifting from just seeing numbers to actually understanding the story behind them. They let you drill down into your data, ask new questions on the spot, and find insights that would stay buried in a spreadsheet.
Ultimately, this empowers your team to make sharper, faster decisions.
Ready to build your first Power BI dashboard or set up a data automation workflow? Contact DataSimplified to discuss how we can turn your business data into a powerful advantage. Learn more at https://datasimplified.co.za.
