Choosing between Tableau and Power BI is a critical decision for any business serious about its data. The right choice depends on your existing systems, team skills, and budget. If your company runs on Microsoft, Power BI is often the natural fit. But for best-in-class data visualisation and flexibility, Tableau is hard to beat. This guide breaks down the key differences to help you decide.
Choosing Your Business Intelligence Tool
Selecting a business intelligence (BI) platform is a strategic decision that shapes how your organisation uses data. For most South African small and mid-sized businesses, the choice comes down to Tableau vs Power BI. While both are market leaders, they approach data analysis from different perspectives.

Power BI is built for accessibility and widespread adoption. Its main advantage is its deep integration with the Microsoft ecosystem, including Office 365 and Azure. This makes it a cost-effective and familiar starting point for companies wanting to empower their teams with self-service analytics. In our business intelligence and reporting projects, we often see teams with strong Excel skills build insightful dashboards quickly.
Tableau, by contrast, is a tool designed for deep, exploratory data analysis and high-impact visualisation. It provides analysts with the freedom to connect to a wide variety of data sources and build complex, interactive dashboards from scratch. This power makes it the preferred tool for dedicated data professionals who need to answer complex business questions. For a more granular look, you can check out a direct comparison of Tableau vs. PowerBI.
In South Africa, the two are neck and neck. As of 2025, market research gives Power BI a slight edge with around 15% of the BI market share, while Tableau follows closely at 13.7%. This small gap is largely due to Power BI’s competitive pricing and its native integration within the Microsoft suite.
To provide a clear overview, let's compare the core differences.
High-Level Comparison Power BI vs Tableau
This table highlights the key differentiators between Power BI and Tableau, offering a quick reference to help frame your decision.
| Criterion | Power BI | Tableau |
|---|---|---|
| Primary Strength | Seamless integration with the Microsoft ecosystem and ease of use for general business users. | Advanced data visualisation, flexibility, and powerful data exploration for analysts. |
| Learning Curve | Lower, especially for users familiar with Microsoft Excel. | Steeper, requiring more dedicated training to master its advanced features. |
| Cost Structure | Generally more affordable, with a free version and cost-effective Pro licences. | Higher cost, with role-based pricing for Creators, Explorers, and Viewers. |
| Data Connectivity | Excellent within the Microsoft stack (Azure, SQL Server) with good general connectivity. | Superior connectivity to a vast and diverse range of third-party data sources. |
While this table provides a snapshot, the best choice depends on your specific business context. This guide will walk you through the details to help you make an informed decision.
Comparing User Experience and Core Capabilities
How a business intelligence tool feels to use directly impacts team adoption and the depth of insights they can uncover. Both Power BI and Tableau aim to make data understandable, but their design philosophies cater to different users and analytical needs.

Power BI offers a structured, ribbon-based interface that is immediately familiar to anyone who uses Microsoft Excel. This is a deliberate design choice to lower the barrier to entry for business professionals. The workflow is guided, taking you from connecting data sources and cleaning them in Power Query to building standard charts and graphs.
For example, an operations manager at a South African retail business could create a daily sales dashboard in a few hours. They could connect to a sales spreadsheet, use the familiar interface to build bar charts showing sales by region, and publish it for their team—no specialised data skills needed. For these common reporting tasks, the learning curve is gentle.
The Power BI Learning Curve: DAX
While Power BI's initial simplicity is an advantage, its complexity lies in DAX (Data Analysis Expressions). This is the formula language required to create custom calculations and advanced measures. DAX is powerful but has a notoriously steep learning curve, with a syntax far removed from simple Excel formulas.
To move from basic reports to genuine business intelligence, mastering DAX is essential for implementing sophisticated logic like period-over-period growth or inventory turnover rates. Without it, users often hit a functional wall.
Tableau's Freeform Analytical Canvas
Tableau provides a different experience with its flexible, blank canvas designed for visual data exploration. Its drag-and-drop interface encourages users to experiment by combining different data dimensions and measures to see what patterns emerge. This makes it ideal for analysts tackling open-ended questions.
Instead of a prescribed workflow, Tableau puts the user in control from the start. Creating calculated fields feels more intuitive than writing complex DAX, as the logic often mirrors natural language.
Tableau’s design philosophy empowers you to start with a question and explore the data visually to find the answer. Power BI is often better at providing structured answers to pre-defined questions.
For instance, a marketing analyst at a local logistics company could use Tableau to investigate customer churn. They might drag customer tenure, service type, and support ticket volume onto the canvas, instantly creating a scatter plot to identify correlations. This type of ad-hoc, exploratory analysis is where Tableau excels, revealing insights that standard reports might miss.
Core Capability Summary
The fundamental difference comes down to the intended user and their workflow.
- Power BI is optimised for the business user. It excels at structured reporting and creating standardised dashboards for organisation-wide distribution. Its strength lies in making self-service analytics accessible to anyone with a solid background in Excel.
- Tableau is built for the data analyst. It offers a powerful, flexible environment for deep data exploration, custom visualisations, and uncovering complex patterns. Its features are geared towards professionals whose primary role is to analyse data and communicate nuanced findings.
Ultimately, Power BI prioritises ease of use and tight integration for widespread adoption, while Tableau prioritises analytical depth and visual flexibility for dedicated data professionals.
Need help building your next Power BI dashboard or data automation workflow? Contact DataSimplified to discuss how we can turn your business data into powerful insights.
How Well Do They Connect? A Look at Data Integration
A business intelligence tool is only as good as the data it can access. Its ability to connect to your existing systems—whether cloud applications or on-premise databases—is a critical factor. Here, the differences between the Microsoft-centric world of Power BI and the platform-agnostic approach of Tableau are clear.
Power BI's main draw is its native integration with the Microsoft stack. If your business uses Azure, SQL Server, Dynamics 365, or even just SharePoint and Excel, Power BI fits in seamlessly. It feels less like a separate tool and more like an extension of your existing infrastructure, making ETL and integration tasks simpler.
Tableau, in contrast, built its reputation on connecting to almost anything. It was designed to pull data from a diverse mix of sources, including Salesforce, Google Analytics, data warehouses like Snowflake, and numerous SQL and NoSQL databases. Its connectivity is famously broad and robust.
Power BI: At Home in the Microsoft Ecosystem
For any organisation invested in Microsoft technologies, Power BI’s integration is a significant advantage. Connecting to sources like Azure Synapse Analytics or a SQL Server database is a smooth process that often shares your existing security and governance frameworks. This tight coupling simplifies data management and reduces setup time.
However, the experience can change when you move outside the Microsoft ecosystem. While Power BI has connectors for many non-Microsoft sources, they are not always as polished. You may face more configuration, and performance with live connections (DirectQuery) can sometimes lag behind its highly optimised import mode.
Tableau: The Universal Translator for Data
Tableau excels in hybrid environments where data is distributed across various systems. Consider a manufacturing firm using a local ERP, a cloud-based CRM, and financial data in a legacy database. Tableau is built for this complexity, offering high-performance connectors for each system.
Its strength in maintaining fast live connections across a wide array of sources is a key differentiator. It allows analysts to query large datasets in real-time without needing to import everything. Managing these diverse connections requires a solid data governance strategy. For more on this, read our seamless system integration guide.
The choice boils down to this: Power BI offers unparalleled depth within the Microsoft ecosystem, whereas Tableau offers incredible breadth across a diverse data landscape.
A Critical Choice: Live vs. Imported Data
Both tools offer different ways to access your data, which impacts dashboard speed and data freshness.
- Import Mode (Power BI) / Extract (Tableau): This method loads data into the BI tool's fast internal engine. Dashboards are typically very responsive, but the data is only as current as the last scheduled refresh. Power BI’s engine is particularly well-optimised for this.
- Live Connection (DirectQuery in Power BI): This method sends queries directly to the source database with every interaction. Your data is always live, but performance depends entirely on the underlying database. Tableau is generally recognised for its superior performance with live queries against very large datasets.
Choosing the right connection type is a crucial part of the data engineering process. You must balance the business need for real-time insights with user expectations for a fast, responsive experience. If your data world is predominantly Microsoft, Power BI offers an efficient and integrated solution. If your data infrastructure is a mix of different systems, Tableau’s connectivity and live query performance provide greater flexibility.
Visualisation and Advanced Analytics
Once data is connected, the next step is building dashboards. This is where the core philosophies of Tableau and Power BI become most apparent. One champions artistic freedom and deep exploration, while the other prioritises speed and AI-assisted discovery.

Tableau is widely regarded as the market leader in pure data visualisation. Its platform gives analysts granular, pixel-perfect control over every element on a dashboard. This flexibility allows for the creation of highly customised, interactive visualisations that can tell a complex data story with clarity.
Tableau: The Gold Standard for Visual Exploration
Tableau's strength lies in its ability to facilitate a free-flowing, intuitive analytical process. An analyst can start with a broad question, visually explore the data, and drill down into details without being confined by a rigid structure. It is the ideal tool for uncovering insights hidden in complex datasets.
For instance, a large South African retailer creating a public-facing annual report dashboard would need precise control over branding, layout, and chart design to craft a compelling narrative. Tableau’s sophisticated mapping capabilities and custom chart options are built for this type of high-stakes, presentation-grade work.
This focus on high-end analytics is driving significant growth. In South Africa, key sectors like banking and telecommunications are using Tableau to analyse large datasets for real-time insights. The global Tableau Services Market, valued at around USD 1.5 billion in 2025, is projected to reach USD 5.4 billion by 2035, with data preparation solutions being a major growth driver.
Power BI: Augmented Analytics and AI-Driven Insights
While Power BI offers a solid library of standard visuals, its key advantage is augmented analytics. Microsoft has invested heavily in embedding AI and machine learning features directly into the platform to help users find answers faster. These features automate parts of the analytical workflow, making it easier for non-data scientists to understand the drivers behind the numbers.
Power BI's most notable AI features include:
- Q&A Natural Language Query: Users can type questions in plain English, such as "show top 10 products by sales in Gauteng," and Power BI will generate the appropriate visualisation.
- Key Influencers Visual: This feature automatically analyses your data to identify the main factors driving a specific outcome, like customer churn or sales success.
- Quick Insights: With a single click, Power BI runs algorithms on your dataset to surface interesting correlations, outliers, and trends that might otherwise be missed.
Tableau gives the dedicated analyst the freedom to craft the perfect visual story. Power BI gives the everyday business user AI-powered tools to get answers quickly.
Imagine an operations manager at a logistics firm. Instead of building complex reports to understand delivery delays, they can use the Key Influencers visual. In minutes, they might discover that "vehicle type" and "delivery route" are the primary causes. This is a perfect example of how Power BI is transforming business intelligence for frontline employees.
The right choice depends on your primary objective. If you need to empower a team of dedicated analysts to conduct deep, exploratory analysis and build bespoke dashboards, Tableau’s visual flexibility is superior. If your goal is to enable users across the organisation to perform self-service analysis and quickly find operational insights with AI assistance, Power BI provides a more direct path.
Licensing, Pricing, and Total Cost of Ownership
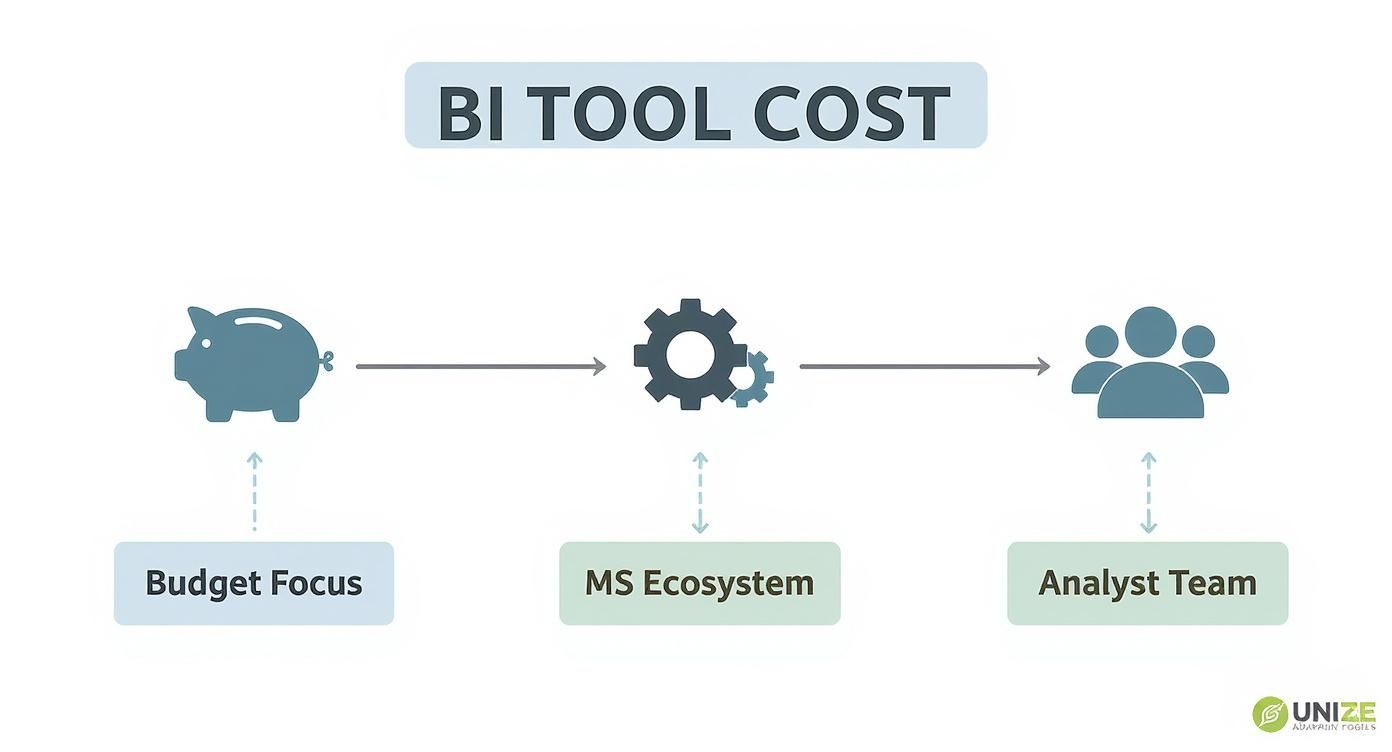
For any business, especially SMEs in South Africa, budget is a primary consideration. When comparing Tableau versus Power BI, the initial price is just the beginning. To make a sustainable decision, you must consider the Total Cost of Ownership (TCO), which includes licensing, training, development, and maintenance.
At first glance, Power BI’s pricing is simple and accessible, particularly for companies already within the Microsoft ecosystem. Its goal is to enable widespread adoption without a large upfront investment. Tableau uses a role-based subscription model, offering precise control over user capabilities but with costs that can increase as your team grows.
How Power BI Licensing Works
Power BI is structured to scale with your business. The licensing tiers are:
- Power BI Free: A personal licence for individual learning and report building. It does not allow for sharing or collaboration, making it unsuitable for team projects.
- Power BI Pro: The standard business licence, typically costing around $10 USD per user per month. It allows users to publish, share, and collaborate on reports. It is often included in Microsoft 365 E5 subscriptions, which means many companies already have access to it.
- Power BI Premium: This tier has two options: Per User (PPU) and by Capacity. PPU provides individuals with advanced features for a higher monthly fee. Premium by Capacity is an enterprise-level solution that allows content distribution to a large audience, including users without a Pro licence.
Breaking Down Tableau's Subscription Tiers
Tableau prices its software based on user roles, which is effective for organisations with a clear distinction between data analysts and report consumers.
- Creator: The top-tier licence for data analysts and developers. It includes Tableau Prep (for data cleaning) and Tableau Desktop (for dashboard creation) and is the most expensive option.
- Explorer: For business users who need to interact with existing dashboards and create their own views from published data sources, but cannot create new data sources from scratch.
- Viewer: The most affordable tier, for users who only need to view and interact with dashboards created by others.
The strategic difference is clear: Power BI’s model is designed for broad, democratic self-service analytics by making the Pro licence incredibly easy to adopt. Tableau’s model, on the other hand, gives you surgical control over user capabilities, tying costs more directly to specialised analytical roles.
Below is a simplified breakdown of typical entry-level costs.
Cost and Licensing Model Overview
| Licensing Tier | Power BI (Typical Model) | Tableau (Typical Model) | Best For |
|---|---|---|---|
| Free/Individual | Power BI Free: For personal use and learning. No sharing. | Tableau Public: A free platform for public data. Not for private company data. | Individuals learning the tool or working on public projects. |
| Standard User | Power BI Pro (~$10/user/month): For creating and sharing reports. Often bundled with M365 E5. | Tableau Viewer (~$15/user/month): For viewing and interacting with existing dashboards. | Teams where most users need to consume and interact with reports. |
| Power User/Analyst | Power BI Premium Per User (~$20/user/month): Access to premium features like AI and larger datasets. | Tableau Creator (~$75/user/month): Full access to build data sources and create dashboards from scratch. | The core data analysts and developers who are building the reports. |
This table shows how per-user costs diverge, especially when comparing a Power BI Pro user to a Tableau Creator. However, remember to account for hidden costs like training, data hosting, and potential add-ons. Power BI's familiarity for Excel users often results in lower training costs, a significant benefit for budget-conscious businesses. Beyond initial setup, actively optimizing software licenses is crucial for managing your TCO.
Need help building your next Power BI dashboard or data automation workflow? Contact DataSimplified to discuss how we can turn your business data into powerful insights.
Making the Right Choice for Your Business
So, how do you decide between Power BI and Tableau? There is no single "better" tool. The right choice depends on your specific business context: your budget, existing technology, and the analytical maturity of your team.
For many South African SMEs, the decision often comes down to cost and infrastructure. If your company already runs on Microsoft 365 and Azure, Power BI is a natural, budget-friendly choice. It allows teams across the business to build and share insights without requiring a data specialist for every request.
On the other hand, if you have a dedicated analyst team focused on deep data exploration, Tableau becomes a compelling option. Its visualisation engine is unmatched, and it connects seamlessly to a wide range of non-Microsoft data sources. It is a powerful tool for identifying complex patterns and building persuasive data narratives.
When Power BI is the Smart Choice
Power BI is ideal for companies aiming to make business intelligence accessible to a broad audience. It is the perfect platform for deploying self-service analytics at scale, enabling departments like sales, operations, or finance to answer their own questions without relying on a central data team.
Choose Power BI if your business:
- Is deeply embedded in the Microsoft ecosystem, using tools like Azure, SharePoint, and Microsoft 365.
- Is focused on total cost of ownership and can benefit from bundled licences and a lower learning curve.
- Wants to empower non-technical users to create operational dashboards for departmental reporting.
When to Invest in Tableau
Tableau is the better choice when your priority is analytical depth and best-in-class visualisations. It is built for organisations that treat data analysis as a core discipline and need a tool capable of handling complex, ad-hoc queries and producing boardroom-ready dashboards.
Lean towards Tableau if your organisation:
- Has dedicated data analysts or data scientists who require a powerful, flexible environment for data exploration.
- Needs to create highly customised, pixel-perfect visualisations for external clients or complex internal analysis.
- Works with a diverse, non-Microsoft data landscape, requiring high-performance connections to various sources.
The tool is only one part of the equation. A successful business intelligence strategy depends on solid data engineering, thoughtful dashboard design, and a clear understanding of the business questions you need to answer.
This decision tree infographic offers a visual guide to the main trade-offs.
For cost-sensitive businesses within the Microsoft world, Power BI is often the default choice. For teams with dedicated analytical roles, the investment in Tableau is typically worthwhile.
Ultimately, the Tableau vs. Power BI debate is about philosophy. Power BI focuses on democratising data access and efficiency, while Tableau emphasizes analytical depth and expert craftsmanship. Choosing the right one lays the foundation for a data-driven culture that aligns with your company's strengths and goals.
Need help building your next Power BI dashboard or data automation workflow? Contact DataSimplified to discuss how we can turn your business data into powerful insights.
Frequently Asked Questions
When choosing between Tableau and Power BI, a few common questions arise. Here are straightforward answers to help South African businesses make the final decision.
Which Tool Is Easier for Non-Technical Staff to Learn?
For anyone familiar with Microsoft Excel, Power BI will feel more intuitive. Its interface is similar to other Office applications, resulting in a gentler learning curve. Business users can often build basic reports with minimal training, making it an excellent choice for deploying self-service BI.
Tableau, on the other hand, is designed for data analysts. Its flexibility for freeform data exploration comes with a steeper learning curve. Mastering its environment to create stunning custom visuals requires a dedicated time investment.
How Do the Tools Handle Large Datasets?
Both platforms are designed to handle large volumes of data, but they do so differently. Power BI relies on its in-memory engine, VertiPaq, which is exceptionally fast once data is imported and modelled. This is ideal for most business reporting where data is refreshed on a schedule.
Tableau's strength lies in its high-performance live connections to massive databases. For real-time analysis directly against a multi-billion row data warehouse, Tableau often has the advantage. Its Hyper data engine is also very fast for creating and querying large data extracts.
For most SMEs, the real question isn't about "big data" but the immediacy of that data. Power BI is fantastic with scheduled refreshes, whereas Tableau really shines when you need to query complex, live operational systems.
Is It Difficult to Migrate from Power BI to Tableau?
Yes, migrating between these tools is a significant undertaking. There is no automated conversion process; dashboards, data models, and business logic must be rebuilt from scratch in the new tool.
The process involves several key steps:
- Rebuilding Data Models: Re-establishing all data connections and relationships.
- Translating Calculations: Manually rewriting DAX formulas from Power BI into Tableau's calculation language, which is often the most complex part.
- Redesigning Visuals: Recreating every chart, graph, and dashboard layout.
- Validating Data: Performing rigorous testing to ensure the new reports produce the same numbers as the old ones.
This complexity requires careful planning, strong data engineering skills, and a thorough validation phase to maintain business continuity and user trust.
Can My Organisation Use Both Tools Effectively?
Absolutely. A hybrid BI environment is a common and practical strategy. Many companies use Power BI for broad, standardised departmental reporting due to its cost-effectiveness and integration with Office 365.
Simultaneously, a dedicated analytics team might use Tableau for deeper, exploratory data science work or for building pixel-perfect dashboards for client presentations. The key to a successful dual-tool strategy is a clear data governance plan that defines which tool to use for specific purposes, ensuring consistency across the organisation.
Struggling to navigate your BI tool selection or planning a migration? DataSimplified offers expert guidance on data strategy and implementation.